T21 Market Profile + VPDescription
T21 Market Profile + Volume Profile is a session-based profiling indicator that combines TPO Market Profile, an independently configurable Volume Profile, Developing POC / Value Area, a fixed-duration Initial Balance (IB), and Session VWAP into a single, integrated tool.
The indicator is designed to help traders understand price acceptance, balance vs. imbalance, and auction structure within each session, while keeping TPO and Volume Profile calculations logically separated and independently configurable.
Core Concepts
TPO Market Profile
The TPO profile is built using lower-timeframe price data.
Each price row represents how many lower-TF bars traded through that price level (TPO count).
The vertical resolution of the TPO profile is controlled by TPO Ticks Per Row, allowing fine or coarse profiles depending on market conditions.
The TPO profile is drawn as a time-scaled shape, where wider areas represent higher price acceptance.
Point of Control (POC) and Value Area
POC is derived from the TPO distribution as the price level with the highest TPO count.
Value Area High (VAH) and Value Area Low (VAL) are calculated by expanding outward from the POC until the selected Value Area percentage is reached.
Developing POC, VAH, and VAL lines update dynamically during the session.
Independent Volume Profile (Key Feature)
The Volume Profile uses its own price-row resolution, controlled by VP Ticks Per Row, completely independent from the TPO grid.
This allows traders to:
Keep a smooth, readable TPO profile
While simultaneously running a high-detail or low-detail Volume Profile, without increasing TPO complexity
Volume is aggregated from lower-timeframe bars and distributed across the price range traded during each bar.
The Volume Profile can be aligned to the right or left side of the session and scaled proportionally to session duration.
This separation between TPO resolution and Volume Profile resolution is intentional and represents a core design feature of the indicator.
Initial Balance (IB)
The Initial Balance is calculated using a fixed time duration in minutes, not a fixed number of bars.
High and Low values are updated only during the defined IB window.
After the IB period ends, the IB range remains fixed and is displayed as a box extending through the session.
This approach ensures consistent IB behavior across different chart timeframes and instruments.
Historical Context
Previous sessions’ POC, VAH, VAL, and Initial Balance boxes can be displayed for contextual reference.
The number of historical sessions retained is user-configurable.
This allows traders to identify prior acceptance levels, balance zones, and structural references.
Session VWAP
A session-anchored VWAP is included.
VWAP resets automatically at each new session defined by the Profile Timeframe.
Useful for contextual alignment between auction structure and volume-weighted price.
How to Use
Set Profile Timeframe to define the session (e.g., Daily).
Adjust TPO Ticks Per Row to control TPO profile detail.
Adjust VP Ticks Per Row independently to fine-tune Volume Profile resolution.
Select lower-timeframe inputs based on market volatility and instrument liquidity.
Use Developing POC, VAH, VAL, IB, and VWAP together to assess balance, acceptance, and potential directional bias.
Limitations and Notes
The Volume Profile distributes bar volume across the price range traded during each lower-timeframe bar.
It is an approximation and not true tick-by-tick volume-at-price.
Results depend on the selected lower-timeframe resolution and data quality.
The script does not use lookahead or future data.
Higher resolution settings increase computational load.
Why the Script Is Closed-Source
This indicator implements a custom architecture that separates TPO and Volume Profile resolution, combines fixed-duration Initial Balance logic, and manages dynamic session-based drawing and historical context within a single framework.
The source code is protected to preserve this implementation while still allowing full public use of the indicator.
Cerca negli script per "volume profile"

Janus Atlas - Multi-Timeframe Auto-LevelsJanus Atlas: Multi-Timeframe Auto-Levels
Janus Atlas transforms scattered price reference points into a unified level-mapping system. The indicator is designed to help traders identify potential support and resistance zones through 15 integrated analytical layers: Higher-Timeframe Levels, Session Ranges, Opening Range, Killzones, Gap Levels, CME Gaps, VWAP Suite, Volume Profile, Previous Period Levels, Fibonacci Retracements, Confluence Zones with Strength Scoring, Market Structure, Fair Value Gaps, and a real-time Distance Table with Hidden Confluence Discovery.
━━━━━━━━━━━━━━━━━━━━━━━━━━━━━━━━━━━━━━
🔶 𝗢𝗩𝗘𝗥𝗩𝗜𝗘𝗪
Price levels are not random. They represent points where market participants previously made decisions. Traders have long tracked daily highs, weekly opens, VWAP, and other reference points to anticipate where price may find support or resistance.
Janus Atlas builds on this foundation by consolidating multiple level types into a single, organized overlay:
• HTF Levels : Daily, Weekly, Monthly, Quarterly, and Yearly Opens/Highs/Lows/Midpoints provide macro context for intraday decisions.
• Session & Custom Ranges : Asian, European, and North American session highs/lows, plus two fully customizable session windows.
• Institutional References : Opening Range, VWAP with standard deviation bands, Volume Profile (POC/VAH/VAL), and naked POC tracking.
• CME Gap Tracking : Weekend gaps from CME futures markets, with automatic fill detection and multi-asset support.
• Previous Period Levels : Yesterday's high/low, last week's range, and prior VWAP values serve as potential memory points for price.
• Technical Overlays : Fibonacci retracements, Fair Value Gaps, Market Structure (BOS/CHoCH), and automatic Confluence Zone detection.
• Distance Table : Real-time distance to nearest levels above and below current price.
Rather than running multiple indicators, Janus Atlas provides a single comprehensive view with smart label management that prevents chart clutter.
━━━━━━━━━━━━━━━━━━━━━━━━━━━━━━━━━━━━━━
🔶 𝗛𝗢𝗪 𝗜𝗧 𝗪𝗢𝗥𝗞𝗦
The indicator operates on one core principle: levels where price previously reacted may warrant attention when revisited, though past reactions do not guarantee future behavior.
Higher-Timeframe Levels (HTF)
What it does: Tracks the Open, High, Low, and Midpoint of the current Day, Week, Month, Quarter, and Year. Monday's range is tracked separately as it often sets the tone for the trading week. All calculations use confirmed bar data with no repainting.
How to interpret it: HTF levels provide context for where price sits within larger structures. A move toward the weekly high while already extended from the monthly midpoint may suggest different conditions than the same move occurring near the monthly low. These levels do not predict direction but help frame the current market position.
Session Levels
What it does: Calculates the Open, High, Low, and Midpoint for three preset sessions (Asian, European, North American) plus two fully customizable session windows. All times respect your selected timezone.
How to interpret it: Session ranges often contain price during their active hours. When price breaks and holds beyond a session range during a subsequent session, this may indicate directional interest, though false breakouts are common and should be considered.
Opening Range (OR)
What it does: Captures the high and low established during a configurable window at market open (default: first 30 minutes). The range is calculated once the window closes and remains fixed for the trading day.
How to interpret it: The Opening Range represents early price discovery. Some traders watch for price to break and hold beyond OR boundaries as a potential indication of intraday direction. OR levels may also act as support/resistance when revisited.
Killzones
What it does: Displays background shading for five high-volume trading windows: Asian (20:00-00:00), London Open (02:00-05:00), NY Open (08:30-11:00), London Close (10:00-12:00), and NY PM (13:00-16:00). All times are configurable.
How to interpret it: Killzones highlight periods of historically elevated volatility and liquidity. Price moves during these windows may carry more significance than moves during quieter periods, though this is not guaranteed.
Gap Levels
What it does: Identifies the gap between the previous session's close and the current session's open for both daily and weekly timeframes. Gap levels are drawn and can trigger alerts when touched.
How to interpret it: Gaps represent price inefficiencies that may attract price back toward them. This concept is sometimes called "gap fill." However, many gaps remain unfilled for extended periods, so gap levels should be viewed as areas of potential interest rather than guaranteed targets.
CME Gaps
What it does: Tracks weekend price gaps from CME futures markets. CME closes Friday at 4pm CT and reopens Sunday at 5pm CT. The indicator compares each week's opening price against the previous week's closing price to identify gaps. Auto-detects the correct CME symbol based on your chart, supporting Bitcoin (BTC1!), Ethereum (ETH1!), S&P 500 (ES1!), Nasdaq (NQ1!), Gold (GC1!), Oil (CL1!), and more.
How to interpret it: CME gaps are widely watched by institutional traders as price magnets. The gap zone represents a price inefficiency that often gets "filled" when price returns to that level. Gap-up zones may act as support while gap-down zones may act as resistance. Gaps auto-remove from the chart once price completely fills them. Not all gaps fill quickly; some remain open for weeks or months.
VWAP Suite
What it does: Calculates Volume-Weighted Average Price for Daily, Weekly, Monthly, Quarterly, and Yearly anchors. Optional standard deviation bands (±1σ, ±2σ) and previous period VWAP values are also available.
How to interpret it: VWAP represents the average price weighted by volume, a benchmark used by institutional traders. Price above VWAP may suggest bullish conditions while price below may suggest bearish conditions, though VWAP alone does not determine trend. The bands indicate statistical extensions from the mean.
Volume Profile
What it does: Displays the Point of Control (POC), Value Area High (VAH), and Value Area Low (VAL) for configurable daily and weekly periods. Naked POC tracking identifies prior POC levels that price has not revisited.
How to interpret it: The POC represents the price with the most traded volume, a potential equilibrium point. VAH and VAL bound the area containing 70% of volume. Price may find support or resistance at these levels, particularly naked POCs that have not been "filled."
Previous Period Levels
What it does: Draws the prior period's Open, High, Low, and Midpoint for Day, Week, Month, Quarter, and Year. These are fixed historical values that update only when a new period begins.
How to interpret it: Previous period levels represent established reference points that many traders monitor. Yesterday's high or last week's low may act as support/resistance when retested, as these levels often coincide with stop placements and pending orders.
Fibonacci Levels
What it does: Provides two independent Fibonacci retracement sets with 20 different anchor options (session highs/lows, HTF extremes, OR boundaries). Standard levels (0.236, 0.382, 0.5, 0.618, 0.786, 0.886) plus extensions (1.272, 1.618) are available.
How to interpret it: Fibonacci retracements identify potential support/resistance based on mathematical ratios. The 0.618 and 0.786 levels are commonly watched for pullback entries, while extensions project potential targets. Effectiveness varies by market conditions.
Confluence Zones
What it does: Automatically detects when multiple levels converge at the same price and displays confluence strength directly on the combined labels. When two or more levels cluster together, the label shows a strength indicator like (×2), (×3), or (×4). An optional shaded zone box can also be enabled.
How to interpret it: Higher confluence counts suggest stronger potential support or resistance. A level showing (×3) means three independent analytical methods identified the same price zone. While this may increase the probability of price reaction, confluence alone does not guarantee support or resistance. Single levels may be less significant than high-confluence zones.
Hidden Confluence Discovery
What it does: The Distance Table can reveal confluence you're missing. When "Show Hidden Confluence" is enabled, the table shows disabled levels that would add confluence to your active levels. For example, seeing "+0.618 (Fib)" next to a level means enabling Fibonacci would create additional confluence at that price.
How to interpret it: This feature helps discover high-confluence zones without needing to enable every system. Orange-highlighted rows indicate potential confluence exists from systems you haven't enabled. Consider enabling those systems to see the full picture.
Market Structure
What it does: Identifies swing highs and lows using pivot detection, then labels them as HH (Higher High), HL (Higher Low), LH (Lower High), or LL (Lower Low) based on comparison to the previous swing. Break of Structure (BOS) and Change of Character (CHoCH) events are marked when price breaks through a labeled swing level.
How to interpret it: HH/HL sequences suggest uptrend. LH/LL sequences suggest downtrend. BOS indicates trend continuation while CHoCH may signal potential trend reversal. The first swing point is tracked silently as a reference, with labeling beginning on subsequent swings. These labels help visualize market structure but should not be followed blindly. False breaks are common.
Fair Value Gaps (FVG)
What it does: Detects price imbalances where a candle's range does not overlap with the candle two bars prior. Bullish FVGs (gaps up) and Bearish FVGs (gaps down) are drawn as boxes. Mitigation tracking shows when price returns to fill these gaps.
How to interpret it: FVGs represent inefficient price delivery that may attract price back for "rebalancing." Unmitigated FVGs may act as support/resistance zones, though not all gaps get filled.
Distance Table
What it does: Displays a real-time table split into ▲ RESISTANCE (levels above price) and ▼ SUPPORT (levels below price) sections. Each row shows the level name, distance (in ticks, percentage, or price), strength rating (★), and hidden confluence discovery (+). Three layout options: Vertical (stacked full columns), Horizontal (side-by-side columns), and Compact (single column).
How to interpret it: The split design provides instant identification of support vs resistance zones. The Strength column shows TOTAL confluence (both enabled AND hidden levels combined), so ★★★★ means four levels converge at that price regardless of what you have enabled. The + column (orange) reveals exactly which disabled systems would add to that confluence. This shows you the TRUE strength of each zone and what to enable to see the full picture on your chart. In this way, the table serves as a learning tool: it teaches you about confluence on your chart that you may not have discovered yet, helping you understand which systems to explore further.
━━━━━━━━━━━━━━━━━━━━━━━━━━━━━━━━━━━━━━
🔶 𝗪𝗛𝗬 𝗧𝗛𝗘𝗦𝗘 𝗖𝗢𝗠𝗣𝗢𝗡𝗘𝗡𝗧𝗦 𝗪𝗢𝗥𝗞 𝗧𝗢𝗚𝗘𝗧𝗛𝗘𝗥
Each level type captures a different aspect of market structure:
1. Time-Based Levels (HTF, Sessions, OR): Anchor price to calendar-driven reference points that reset on predictable schedules.
2. Volume-Based Levels (VWAP, Volume Profile): Identify where actual trading activity concentrated, revealing institutional positioning.
3. Historical Levels (Previous Periods, Naked POC, CME Gaps): Mark where price previously found significance, creating potential "memory" points.
4. Technical Levels (Fibonacci, FVG, Market Structure): Apply mathematical and structural analysis to identify potential reaction zones.
5. Synthesis (Confluence Zones, Distance Table): Combine multiple inputs to highlight high-priority areas and provide real-time context.
When multiple factors align (for example, the weekly VWAP coinciding with yesterday's high near a 0.618 Fibonacci level), this represents confluence that may warrant additional analysis. Such conditions do not guarantee any particular outcome but may help prioritize attention.
━━━━━━━━━━━━━━━━━━━━━━━━━━━━━━━━━━━━━━
🔶 𝗛𝗢𝗪 𝗧𝗢 𝗨𝗦𝗘
This section provides step-by-step guidance for interpreting the indicator's visual elements and incorporating them into analysis.
Step 1: Enable Relevant Systems
Begin by selecting which level types match your trading approach. The Controls section provides master toggles for all 15 systems. For intraday trading, you might enable HTF Levels, VWAP, Previous Periods, and Opening Range. For swing trading, HTF Levels, Volume Profile, and Fibonacci may be more relevant.
Start with fewer systems enabled and add more as you become familiar with each. Enabling all systems simultaneously can create visual clutter despite the smart label management.
Step 2: Identify the Current Context
Before analyzing specific levels, establish where price sits within the broader structure:
• Is price above or below the daily VWAP?
• Is price in the upper or lower half of the weekly range?
• Has price broken beyond yesterday's high or low?
This context helps interpret whether individual level touches represent potential support, resistance, or continuation.
Step 3: Watch for Level Approaches
As price approaches a level, observe the behavior:
• Does price slow down and consolidate near the level?
• Does price pierce through quickly then reverse?
• Does price break through with momentum and hold?
These observations provide clues about the level's significance, though no single pattern guarantees a particular outcome.
Step 4: Note Confluence Areas
Enable Confluence Zones to automatically highlight areas where multiple levels cluster. When approaching a confluence zone:
• Multiple independent analytical methods agree on the area's significance
• The label shows strength: (×2), (×3), (×4) indicate how many levels converge
• Higher confluence counts may represent higher-probability reaction points
• However, strong momentum can push through even strong confluence
Example Scenario A: Support Confluence
BTC down 2.3% from the open. A combined label shows "pdL · wVWAP · 0.618 (×3)" at 94,200 (yesterday's low, weekly VWAP, and a Fib level converging). The (×3) indicates three independent methods agree on this zone. Distance Table shows ★★★ for this level. Price reaches the zone, wicks through by $50, prints a hammer. High-confluence zones often attract reactions.
Example Scenario B: Hidden Confluence Discovery
ES approaching a level labeled "wH ★★" in the Distance Table. You notice "+0.618 (Fib)" in orange next to it. This means enabling Fibonacci would reveal a third level at this price. You enable Fibs and now see "wH · 0.618 (×3) ★★★" - confluence you didn't know existed.
Example Scenario C: Breakout Setup
NY Open killzone active (purple shading). Price consolidates between Opening Range levels (orH at 4,520, orL at 4,508) for 20 minutes. A candle breaks above orH while also clearing the Asian session high (asH). Two levels broken together during a high-volume window. Clustered breakouts during active sessions may indicate directional interest, though false breaks remain common.
Example Scenario D: Trend Continuation
ES trending higher for three sessions. Price pulls back to dVWAP, touches it, bounces. This pattern repeats twice more over the day. Each dip to VWAP finds buyers. No bearish signals present: price remains above all daily levels, no divergence with higher timeframes. VWAP acting as dynamic support during established trends often indicates institutional accumulation on pullbacks.
Step 5: Use the Distance Table
Position the Distance Table in a corner that doesn't obstruct price action. Use it to:
• Quickly identify the nearest level above and below
• See confluence strength (★★★ = high priority, ★ = lower priority)
• Discover hidden confluence: orange text shows what you're missing (e.g., "+0.618 (Fib)")
• Plan potential target areas for existing positions
The table scans 45+ levels across all systems. Even disabled systems are checked so you can discover confluence opportunities you didn't know existed.
For mobile trading, use Compact layout with Tiny text size and Bottom Center position.
Step 6: Set Relevant Alerts
With 52 alert conditions available, focus on the levels most relevant to your trading:
• Previous Day High/Low touches for day trading
• Weekly VWAP touches for swing positioning
• Opening Range breakouts for momentum plays
• CME Gap fills for magnet-level targets
Alerts fire on confirmed bar close only, preventing false triggers from wicks.
Step 7: Adjust Visual Settings
Customize the appearance to match your preferences:
• Line Dim % reduces line brightness relative to labels
• Extend Lines Right can be disabled for cleaner charts
• Label Combine % controls when nearby labels merge
• Label Style switches between Box and Text Only modes
━━━━━━━━━━━━━━━━━━━━━━━━━━━━━━━━━━━━━━
🔶 𝗡𝗔𝗩𝗜𝗚𝗔𝗧𝗜𝗡𝗚 𝗗𝗜𝗙𝗙𝗘𝗥𝗘𝗡𝗧 𝗠𝗔𝗥𝗞𝗘𝗧 𝗖𝗢𝗡𝗗𝗜𝗧𝗜𝗢𝗡𝗦
Trending Markets
In strong uptrends, price often holds above dVWAP for extended periods. Pullbacks to VWAP frequently find support as institutions accumulate at fair value. Levels below price (pdL, wL) become less relevant while levels ahead gain importance. Focus shifts to resistance references in the direction of the move.
Ranging Markets
During consolidation, price oscillates between previous period highs and lows. The Volume Profile POC often acts as an equilibrium point, with price returning to it repeatedly. Market Structure may show alternating BOS labels in both directions without clear CHoCH. Opening Range boundaries frequently contain price on range-bound days. Confluence zones near range extremes may produce stronger reactions than mid-range levels.
High Volatility Events
During major news events, price may break through multiple levels rapidly. VWAP bands help gauge statistical extension: price at d+2σ or d-2σ represents 2 standard deviations from mean, an uncommon reading. Levels created during volatile sessions (gaps, new swing points) often become significant references once volatility subsides. Killzone shading helps identify whether moves occur during expected high-activity windows or quiet periods.
Weekend Gap Scenarios
CME gaps created over the weekend often act as price magnets during the following week. A gap-up zone (where Sunday's open was higher than Friday's close) may provide support if price pulls back to that level. Unfilled CME gaps from weeks or months prior can suddenly become relevant when price returns to those zones.
━━━━━━━━━━━━━━━━━━━━━━━━━━━━━━━━━━━━━━
🔶 𝗧𝗘𝗖𝗛𝗡𝗜𝗖𝗔𝗟 𝗗𝗘𝗧𝗔𝗜𝗟𝗦
• HTF data retrieved using request.security() with lookahead disabled for non-repainting behavior
• VWAP calculated using cumulative (price × volume) / cumulative volume methodology
• Volume Profile uses configurable lookback periods with session-based anchoring
• Market Structure pivot detection uses left/right bar confirmation with configurable sensitivity
• FVG detection requires complete non-overlap between current candle and two bars prior
• Confluence zones calculated by scanning all active levels within threshold percentage
• Hidden confluence discovery scans 45+ potential levels from all systems regardless of enable state
• CME gaps retrieved via weekly request.security() calls comparing week open vs previous week close
• All signals fire on bar close only. Historical display matches live behavior.
• Smart label combining merges labels within configurable price threshold
━━━━━━━━━━━━━━━━━━━━━━━━━━━━━━━━━━━━━━
🔶 𝗨𝗡𝗜𝗤𝗨𝗘 𝗙𝗘𝗔𝗧𝗨𝗥𝗘𝗦
• Hidden Confluence Discovery : The Distance Table reveals confluence you're missing. Stars show TOTAL strength (enabled + hidden combined), and orange text shows exactly which disabled levels would add to that confluence. Scans 45+ levels across all systems to show you the TRUE strength of each zone.
• Split Support/Resistance Table : Distance Table separates levels into ▲ RESISTANCE (above price) and ▼ SUPPORT (below price) sections for instant directional identification. Three layouts: Vertical (full columns), Horizontal (side-by-side), and Compact (single column).
• Confluence Strength Scoring : Combined labels show (×2), (×3), (×4) indicating how many independent systems agree on a level. Stars reflect total confluence including hidden levels.
• 15 Integrated Systems : Comprehensive level mapping without indicator stacking
• Smart Label Management : Nearby labels automatically combine to prevent clutter (e.g., "dH · wH · mH" when highs align)
• CME Gap Tracking : Weekend gaps with auto-detection for 22+ futures symbols
• Flexible Timezones : All session times configurable with six timezone options including Exchange time
• Dual Fibonacci Sets : Two independent retracement systems with 20 anchor options each
• Naked POC Tracking : Historical POC levels that price has not revisited
• Non-Repainting Architecture : All calculations use confirmed bar data only; historical display matches live behavior
━━━━━━━━━━━━━━━━━━━━━━━━━━━━━━━━━━━━━━
🔶 𝗦𝗘𝗧𝗧𝗜𝗡𝗚𝗦 𝗢𝗩𝗘𝗥𝗩𝗜𝗘𝗪
• Controls : Master toggles for all 15 level systems
• Appearance : Label style, size, spacing, line width, dimming, timezone selection
• HTF Levels : Daily/Weekly/Monthly/Quarterly/Yearly Open/High/Low/Mid toggles
• Session Levels : Asian/European/NA session times and display options
• Custom Sessions : Two user-defined session windows with custom names
• Opening Range : Duration and display settings
• Killzones : Five preset killzone windows with individual toggles
• Gap Levels : Daily and weekly gap display options
• CME Gaps : Auto-detect toggle, manual symbol selection, display style, max gaps, colors
• VWAP Levels : Multi-timeframe VWAP with band settings and previous values
• Volume Profile : POC/VAH/VAL display with naked POC tracking
• Previous Periods : Prior period level toggles across all timeframes
• Fibonacci Levels : Dual retracement sets with anchor and level selection
• Confluence Zones : Strength display toggle, optional zone box, proximity settings (Ticks/Price/%), minimum levels
• Market Structure : Pivot sensitivity, label display, connection lines
• Fair Value Gaps : Lookback, mitigation tracking, display options
• Distance Table : Position, layout (Vertical/Horizontal), size, units, level limit, strength column (★), and hidden confluence discovery
• Alerts : 52 selectable alert conditions
━━━━━━━━━━━━━━━━━━━━━━━━━━━━━━━━━━━━━━
🔶 𝗔𝗟𝗘𝗥𝗧𝗦
Janus Atlas provides 52 alert conditions organized into Individual Alerts and Grouped Alerts.
Individual Alerts fire for specific high-priority levels:
• Previous Day: pdO, pdH, pdL
• Daily: dO, dH, dL
• Weekly: wO, wH, wL
• Monday: moO, moH, moL
• Opening Range: orH, orL
• VWAP: dVWAP, wVWAP, pdVWAP
• Volume Profile: dPOC, dVAH, dVAL, wPOC, wVAH, wVAL
• Gap: gapH, gapL, Gap Filled
• CME Gap: CME Gap New, CME Gap Filled
• Market Structure: CHoCH Bullish, CHoCH Bearish, BOS Bullish, BOS Bearish
• FVG: Bullish FVG, Bearish FVG
• Naked POC: dnPOC, wnPOC
• Other: Fib Level Touched, Confluence Zone
Grouped Alerts cover multiple related levels efficiently:
• Monthly (mO, mH, mL)
• Quarterly (qO, qH, qL)
• Yearly (yO, yH, yL)
• Sessions (Asia/Euro/NY O/H/L)
• Custom Sessions (CS1/CS2 H/L)
• Previous Week/Month/Quarter/Year
• HTF VWAP (mVWAP, qVWAP, yVWAP)
• Previous VWAP (pwVWAP, pmVWAP, pqVWAP, pyVWAP)
• Monthly/Quarterly/Yearly Volume Profile
━━━━━━━━━━━━━━━━━━━━━━━━━━━━━━━━━━━━━━
🔶 𝗟𝗜𝗠𝗜𝗧𝗔𝗧𝗜𝗢𝗡𝗦
• Levels indicate areas of potential interest, not guaranteed support or resistance
• Past level reactions do not predict future behavior
• Strong momentum can push through even high-confluence zones
• CME gap data requires a supported chart symbol (auto-detect handles most cases)
• Enabling too many systems simultaneously may create visual clutter
• Volume Profile accuracy depends on available volume data from exchange
━━━━━━━━━━━━━━━━━━━━━━━━━━━━━━━━━━━━━━
🔶 𝗖𝗢𝗡𝗖𝗟𝗨𝗦𝗜𝗢𝗡
Janus Atlas consolidates 15 distinct level systems into a unified overlay, providing comprehensive price structure analysis without indicator stacking. From time-based references (HTF, sessions) to volume-based levels (VWAP, POC) to technical overlays (Fibonacci, FVG, Market Structure, CME Gaps), the indicator maps potential areas of interest across multiple analytical frameworks.
The smart label management, automatic confluence detection, and real-time distance table help traders quickly identify high-priority zones while maintaining chart clarity. Whether used for intraday scalping or swing trading, Janus Atlas provides the structural context to frame trading decisions.
━━━━━━━━━━━━━━━━━━━━━━━━━━━━━━━━━━━━━━
🔶 𝗗𝗜𝗦𝗖𝗟𝗔𝗜𝗠𝗘𝗥
Trading is risky and most traders lose money. This indicator is provided for informational and educational purposes only. It does not constitute financial advice, and past performance does not guarantee future results. All content, tools, and analysis should not be considered as recommendations to buy or sell any asset. Users are solely responsible for their own trading decisions. Always use proper risk management and consider consulting a qualified financial advisor before making trading decisions.
━━━━━━━━━━━━━━━━━━━━━━━━━━━━━━━━━━━━━━
For access and support, please send a private message.

Price Volume Heatmap [MHA Finverse]Price Volume Heatmap - Advanced Volume Profile Analysis
Unlock the power of institutional-level volume analysis with the Price Volume Heatmap indicator. This sophisticated tool visualizes market structure through volume distribution across price levels, helping you identify key support/resistance zones, high-probability reversal areas, and optimal entry/exit points.
🎯 What Makes This Indicator Unique?
Unlike traditional volume indicators that only show volume over time, this heatmap displays volume distribution across price levels , revealing where the most significant trading activity occurred. The gradient coloring system instantly highlights high-volume nodes (areas of strong interest) and low-volume nodes (potential breakout zones).
📊 Core Features
1. Dynamic Volume Heatmap
- Visualizes volume concentration across 250 customizable price levels
- Gradient color scheme from high volume (white) to low volume (teal/green)
- Adjustable brightness multiplier for enhanced contrast and clarity
- Real-time updates as market conditions evolve
2. Point of Control (POC)
- Automatically identifies the price level with the highest traded volume
- Acts as a magnetic price level where markets often return
- Critical for identifying fair value areas and potential reversal zones
- Customizable line style, width, and color
3. Flexible Lookback Settings
- Lookback Bars: Set any value from 1-5000 bars to control analysis depth
- Visible Range Mode: Analyze only what's currently visible on your chart
- Timeframe-Specific Settings: Different lookback periods for 1m, 5m, 15m, 30m, 1h, Daily, and Weekly charts
- Adapts to your trading style - scalping to position trading
4. Session Separation Analysis
- Tokyo Session: 00:00-09:00 UTC
- London Session: 07:00-16:00 UTC
- New York Session: 13:00-22:00 UTC
- Sydney Session: 21:00-06:00 UTC
- Daily Reset: Analyze each trading day independently
Session separation allows you to understand volume distribution specific to each major trading session, revealing institutional order flow patterns and session-specific support/resistance levels.
5. Profile Width Options
- Dynamic: Profile width adjusts based on lookback period
- Fixed Bars: Set a specific bar count for consistent profile width
- Extend Forward: Project the profile into future bars for planning trades
6. Smart Alerts
- POC crossover/crossunder alerts
- New session start notifications
- Never miss critical price action at high-volume nodes
📈 How to Use This Indicator Professionally
Understanding Market Structure:
High Volume Nodes (HVN):
- Appear as bright/white areas in the heatmap
- Represent price levels where significant trading occurred
- Act as strong support/resistance zones
- Markets often consolidate or bounce from these levels
- Trading Strategy: Look for entries when price tests HVN areas with confluence from other indicators
Low Volume Nodes (LVN):
- Appear as darker/teal areas in the heatmap
- Represent price levels with minimal trading activity
- Price tends to move quickly through these areas
- Often form "gaps" in the volume profile
- Trading Strategy: Expect rapid price movement through LVN zones; avoid placing stop losses here
Point of Control (POC):
- The single most important price level in your analysis window
- Represents the fairest price where maximum volume traded
- Price gravitates toward POC like a magnet
- Trading Strategy:
* When price is above POC: bullish bias, POC acts as support
* When price is below POC: bearish bias, POC acts as resistance
* POC breaks often lead to significant trend changes
Session-Based Analysis:
Use session separation to understand how different market participants trade:
Asian Session (Tokyo/Sydney):
- Typically lower volatility and range-bound
- Volume profiles often show tight, balanced distribution
- Use for identifying overnight ranges and gap fill zones
London Session:
- Highest volume session for forex pairs
- Often shows strong directional bias
- Look for breakouts from Asian ranges during London open
New York Session:
- Maximum participation when overlapping with London
- Institutional order flow most visible
- POC during NY session often becomes key level for following sessions
🎯 Practical Trading Applications
1. Identifying Support & Resistance:
High volume nodes from the heatmap are far more reliable than traditional swing highs/lows. When price approaches an HVN, expect reaction - either a bounce or a significant breakout if breached.
2. Trend Confirmation:
- Healthy uptrend: POC rising over time, HVN forming at higher levels
- Healthy downtrend: POC falling over time, HVN forming at lower levels
- Consolidation: POC relatively flat, volume balanced across range
3. Breakout Trading:
When price breaks through a Low Volume Node with momentum, it often continues to the next High Volume Node. Use LVN areas as measured move targets.
4. Reversal Zones:
Multiple HVN stacking on top of each other creates a "volume shelf" - an extremely strong support/resistance zone where reversals are highly probable.
5. Risk Management:
- Place stops beyond HVN areas (not within LVN zones)
- Size positions based on distance to nearest HVN
- Use POC as trailing stop level in trending markets
⚙️ Recommended Settings
For Day Trading (Scalping/Intraday):
- Lookback: 200-500 bars
- Rows: 200-250
- Enable session separation for your primary trading session
- Profile Width: Dynamic or Fixed Bars (30-50)
For Swing Trading:
- Lookback: 500-1000 bars
- Rows: 250
- Session separation: Daily Reset
- Profile Width: Dynamic
For Position Trading:
- Lookback: 1000-3000 bars
- Rows: 250
- Use timeframe-specific settings
- Profile Width: Extend Forward (20-50 bars)
💡 Pro Tips
1. Combine this indicator with price action analysis - volume confirms what price is telling you
2. Watch for POC convergence with other technical levels (fibonacci, pivot points, moving averages)
3. Volume at extremes (tops/bottoms of heatmap) often indicates exhaustion
4. Session POC from previous sessions often acts as magnet for current session
5. Increase brightness multiplier (1.5-2.5) for clearer visualization on busy charts
6. Use "Number of Sessions to Display" to analyze consistency of volume levels across multiple sessions
🎨 Customization
Fully customizable visual appearance:
- Gradient colors for volume visualization
- POC line thickness, color, and style
- Session line colors and visibility
- All settings organized in intuitive groups
⚠️ Disclaimer
This indicator is a technical analysis tool and should not be used as the sole basis for trading decisions. Always combine volume analysis with proper risk management, fundamental analysis, and other technical indicators. Past performance does not guarantee future results.
---
Support & Updates
Regular updates and improvements are made to enhance functionality. For questions, suggestions, or bug reports, please use the comments section below.
Happy Trading! 📊💹

Institutional Dominance & Trapped Trader @MaxMaserati 3.0 Institutional Dominance & Trapped Trader Delta Profile @MaxMaserati 3.0
═════════════════════════════════════════════════════════════
Overview
The IDT Auction Profile is a professional-grade volume order flow analysis tool that reveals where institutional traders hold Positional Advantage and where retail participants are Trapped. Unlike traditional Volume Profile indicators, the IDT Profile integrates Volume Point Delta (VPD) analysis with advanced pattern recognition to identify the exact price levels where profitable institutional positions create support/resistance, and where losing positions are forced to exit.
This indicator answers the critical questions: Who is in profit? Who is trapped? And where will they defend or exit their positions?
═════════════════════════════════════════════════════════════
Core Concept: Dominance vs Trapped Positioning
════════════════════════════════════════════════════════════TThe indicator categorizes all market participants into two strategic positions based on their entry price relative to current market price:
Above Current Price (Resistance Zones)
🔴 Aggressive Sellers in Profit - Sold higher, currently winning. Will defend positions or add to winners.
🟥 Trapped Buyers at Loss - Bought higher, currently losing. Must exit at breakeven, creating resistance.
Below Current Price (Support Zones)
🟢 Aggressive Buyers in Profit - Bought lower, currently winning. Will defend positions or add to winners.
🟩 Trapped Sellers at Loss - Sold lower, currently losing. Must cover at breakeven, creating support.
Maximum Confluence Zones
When Dominant (Profitable) and Trapped (Loss) positions align at the same level, you get the strongest support/resistance zones. These appear as:
🟧 Orange Boxes (Above Price) = Aggressive Sellers + Trapped Buyers = STRONGEST RESISTANCE
🟨 Yellow Boxes (Below Price) = Aggressive Buyers + Trapped Sellers = STRONGEST SUPPORT
═════════════════════════════════════════════════════════════
VOLUME ANALYSIS
═════════════════════════════════════════════════════════════
1. VPD Column (Volume Point Delta)
Net aggressive pressure at each price level (Buying Volume - Selling Volume).
Bullish Delta (Green): Buyers dominated the auction at this level
Bearish Delta (Red): Sellers dominated the auction at this level
Smart Coloring: Automatically highlights institutional patterns (icebergs, absorption, spikes, failed auctions)
2. VPS Column (Volume Point of Sell - ASK Volume)
Aggressive buying volume that "lifted the offer" by hitting ask prices.
Represents participants who paid the ask price to enter long
When price is below this level = These buyers are in profit
When price is above this level = These sellers who got hit are in profit
3. VPB Column (Volume Point of Buy - BID Volume)
Aggressive selling volume that "hit the bid" by taking bid prices.
Represents participants who sold at bid price to enter short
When price is above this level = These sellers are in profit
When price is below this level = These buyers who got hit are in profit
═════════════════════════════════════════════════════════════
🧠 ADVANCED INSTITUTIONAL PATTERNS DETECTION
═════════════════════════════════════════════════════════════
The indicator uses statistical analysis (standard deviation, moving averages, hit counting) to identify institutional footprints:
Failed Auctions ⚡
"BUYERS TRAPPED" or "SELLERS TRAPPED" labels
High volume entered, but price immediately reversed
Creates extreme concentrations of losing positions
Trading Implication: High-probability reversal zones where trapped participants must exit
Volume Spikes 📈📉
Bright green/red bars in VPD column
Volume exceeds average by 2+ standard deviations
Represents aggressive institutional entry
Trading Implication: Potential trend continuation or setup for failed auction
Absorption Zones 🛡️
Yellow/Orange colored bars
Large passive orders absorbing aggressive volume without price movement
Indicates accumulation (bullish) or distribution (bearish)
Trading Implication: Institutional positioning before major moves
Iceberg Orders 🧊
Cyan colored bars with high hit counts
Same price level shows repeated volume without clearing
Reveals hidden institutional limit orders split into small pieces
Trading Implication: Strong liquidity magnets, price often returns here
Volume Exhaustion 💜
Purple colored bars
Sharp volume drop (50%+) after spike
Momentum exhausted, participants depleted
Trading Implication: Potential reversal or consolidation ahead
═════════════════════════════════════════════════════════════
Colors bars based on detected patterns vs simple red/green
═════════════════════════════════════════════════════════════
Yellow = Bullish battles won
Orange = Bearish battles won
Cyan = Iceberg orders
Purple = Large passive orders
Bright Green = Buying spikes
Bright Red = Selling spikes
═════════════════════════════════════════════════════════════
Confluence Scoring ⭐
═════════════════════════════════════════════════════════════
Each price level receives 1-5 stars based on:
Volume spike presence (+2 stars)
Absorption pattern (+1 star)
Large passive orders (+1 star)
Proximity to Value Area (+1 star)
Iceberg detection (+2 stars)
Failed auction (+2 stars)
Minimum Signal Strength filter lets you show only levels with ★3+ confluence for highest-quality signals.
═════════════════════════════════════════════════════════════
📍 Value Area Analysis
═════════════════════════════════════════════════════════════
VAH (Value Area High) - Blue Line
Top of the 70% volume acceptance zone. Price at VAH often rejects downward.
VAL (Value Area Low) - Red Line
Bottom of the 70% volume acceptance zone. Price at VAL often bounces upward.
Trading Applications:
Price outside Value Area → Mean reversion opportunity
Price breaks VA with volume → Trend continuation
Price oscillates within VA → Range-bound, fade extremes
═════════════════════════════════════════════════════════════
EXPECTED PORICE BEHAVIOR AT KEY LEVELS
═════════════════════════════════════════════════════════════
⚠️ IMPORTANT: These are observed behavioral patterns for educational purposes and backtesting research. Always validate with 250-500+ backtest trades before risking capital. Use this indicator to enhance your existing strategy, not as a standalone system.
1. POC Box Zones (Highest Statistical Relevance)
═════════════════════════════════════════════════════════════
🟨 Yellow Boxes (Below Current Price)
Expected Behavior:
Price approaching from above typically encounters buying pressure
Both profitable institutional buyers and trapped short sellers create demand
Common reaction: Price slows, consolidates, or bounces
Failed bounces often lead to rapid breakdown (trapped buyers capitulate)
What Often Happens:
Initial dip into zone → Weak bounce attempt
Second test → Stronger bounce (trapped sellers covering + buyers defending)
Break below → Quick acceleration as both groups exit
Backtesting Focus:
Measure bounce success rate at ★3+ vs ★4-5 zones
Track how often price returns after initial rejection
Compare behavior during trending vs ranging markets
🟧 Orange Boxes (Above Current Price)
Expected Behavior:
Price rallying into zone typically encounters selling pressure
Both profitable institutional sellers and trapped long buyers create supply
Common reaction: Price stalls, consolidates, or rejects
What Often Happens:
Initial push into zone → Weak rejection
Second test → Stronger rejection (trapped buyers exiting + sellers defending)
Break above → Quick acceleration as resistance becomes support
Backtesting Focus:
Measure rejection success rate by confluence score
Track false breakouts vs genuine breakouts
Identify market conditions that favor breakouts vs reversals
2. Failed Auction Zones
═════════════════════════════════════════════════════════════
"SELLERS TRAPPED" Labels (Below Price)
Expected Behavior:
High-volume selling that immediately reversed = maximum trapped short positions
When price returns to this level, trapped sellers face pressure to cover
Typical pattern: Price approaches → Initial hesitation → Sharp bounce
Common Price Action:
First retest: Quick spike through level then immediate recovery
Subsequent retests: Stronger bounces as fewer trapped sellers remain
Level becomes support after trapped positions cleared
Backtesting Focus:
Success rate of bounces on first vs second retest
Time decay: Does signal strength diminish after X bars?
Volume characteristics during successful bounces
"BUYERS TRAPPED" Labels (Above Price)
Expected Behavior:
High-volume buying that immediately failed = maximum trapped long positions
Price returning forces trapped buyers to exit at breakeven
Typical pattern: Price approaches → Distribution → Rejection
Common Price Action:
First retest: Shallow penetration then swift rejection
Multiple retests: Weaker rallies as trapped positions cleared
Level becomes resistance until breakout occurs
Backtesting Focus:
How many retests before level breaks?
Volume profile changes on each successive test
Correlation with broader market direction
3. Value Area Dynamics
═════════════════════════════════════════════════════════════
Price Outside Value Area (VAH/VAL)
Expected Behavior:
Price beyond 70% volume zone = statistical outlier
Two outcomes: Mean reversion OR trend continuation
Key differentiator: Presence of confluence zones
Mean Reversion Pattern (No Strong Confluence):
Price extends 1-2% beyond VA → Typically reverts toward POC
Weak volume on extension → Higher probability of reversal
Price oscillates back into value area over several bars
Breakout Pattern (With ★4+ Confluence):
Price breaks VA with institutional patterns → Often continues
Strong volume + confluence = New value area forming
Old VA becomes reference point for pullbacks
Backtesting Focus:
Success rate of fades based on distance from VA
Confluence requirements for successful breakouts
Time of day / session impact on VA behavior
4. Iceberg Order Behavior
═════════════════════════════════════════════════════════════
Cyan Bars with High Hit Counts
Expected Behavior:
Repeated volume at same level = Large hidden order absorbing
Price typically "tests" iceberg multiple times before resolution
Two outcomes: Absorption complete (break) OR rejection (bounce)
Absorption Phase:
Price approaches → Slows near iceberg → Minimal movement
Volume increases but price range contracts
Acts as temporary support/resistance
Resolution Phase:
Iceberg filled → Sudden acceleration through level
Iceberg defended → Sharp rejection away from level
Post-resolution: Level often becomes support/resistance flip
Backtesting Focus:
Average number of tests before resolution
Volume characteristics when iceberg breaks vs holds
Timeframe impact on iceberg effectiveness
5. Volume Spike Patterns
═════════════════════════════════════════════════════════════
Bright Green/Red Bars (Institutional Aggression)
Expected Behavior:
Extreme delta spikes indicate institutional entry
Two scenarios: Continuation (spike in trend direction) OR Exhaustion (spike against trend)
Trend Continuation Spikes:
Spike + ★4+ confluence + aligned with trend = Often continues
Price may consolidate briefly then resume direction
These levels become support/resistance on pullbacks
Exhaustion Spikes:
Spike against trend + followed by reversal = Failed auction forming
High probability of "TRAPPED" label appearing
Often marks short-term extremes
Backtesting Focus:
Distinguish continuation vs exhaustion spikes
Success rate based on trend alignment
Time holding before reversal occurs
═════════════════════════════════════════════════════════════
💡 Best Practices
═════════════════════════════════════════════════════════════
Start with defaults (200 lookback, 60 rows, ★3 confluence, Classic colors, Smart Coloring ON)
Focus on POC boxes first - These are your highest-probability zones
Combine with price action - Use the profile to explain WHY support/resistance exists
Watch for alignment - Yellow/Orange boxes (both participant types) = strongest levels
Respect failed auctions - "TRAPPED" labels are extreme reversal setups
Use Value Area for context - Price outside VA = opportunity for mean reversion
Trust confluence scores - ★4-5 signals are institutional-grade setups
Adjust timeframe settings - Lower lookback for scalping, higher for position trading
🔧 Technical Notes
Calculation: Enhanced delta using OHLC and volume with wick ratio analysis
Updates: Real-time on every bar close
Performance: Optimized for up to 500 bars lookback and 250 price rows
Compatibility: Works on all symbols and timeframes
Indicator Unique Value
═════════════════════════════════════════════════════════════
Unlike standard Volume Profile indicators that only show where volume occurred,
the IDT Auction Profile:
✅ Separates bid vs ask volume to reveal true order flow
✅ Identifies who is profitable vs who is trapped at each level
✅ Detects institutional patterns (icebergs, absorption, failed auctions)
✅ Calculates confluence scores combining multiple factors
✅ Provides clear POC boxes showing exact institutional positioning
✅ Maps positional advantage rather than just volume density
This transforms Volume Profile from a historical volume chart into a strategic positioning map showing institutional dominance and trapped participants.
How to Integrate with Your Strategy
═════════════════════════════════════════════════════════════
✅ Proper Uses:
Entry refinement within your existing setups
Intelligent stop placement beyond institutional levels
Objective profit targets at next confluence zones
Trade filtering (only take setups at ★4+ zones)
Understanding market positioning before entry
❌ What It Cannot Do:
Predict direction with certainty
Replace risk management
Account for news/external events
Guarantee profitability
Work in all market conditions
Development Path (12-16 Weeks)
Weeks 1-2: Observation Only
Watch price behavior at key levels
Document patterns without trading
Weeks 3-8: Paper Trading
Simulate trades, track all metrics
Minimum 100 paper trades
Weeks 9-16: Small Size Testing
Minimal capital, real market conditions
Continue tracking, refine rules
After Proven Edge: Scale Position Sizing
Critical Disclaimers
⚠️ Past volume ≠ Future price action
⚠️ Institutional positions change rapidly - these are static snapshots
⚠️ No indicator works 100% - risk management is mandatory
⚠️ Market conditions change - adapt your approach
⚠️ Backtest with YOUR style, YOUR timeframe, YOUR risk tolerance
The indicator reveals WHERE institutions are positioned and HOW they might behave. YOU decide IF, WHEN, and HOW to trade that information.
Not financial advice. For educational and research purposes only.

Market Structure Volume Time Velocity ProfileThis is the Market Structure Volume Time Velocity Profile (MSVTVP). It combines event-based profiling with advanced metrics like Time and Velocity (Flow Rate). Instead of fixed time periods, profiles are anchored to critical market events (Swings, Structure Breaks, Delta Breaks), giving you a precise view of value development during specific market phases.
## The 3 Dimensions of the Market
Unlike standard tools that only show Volume, MSVTVP allows you
to switch between three critical metrics:
1. **VOLUME Profile (The "Where"):**
* Shows standard acceptance. High volume nodes (HVN)
are magnets for price.
2. **TIME Profile (The "How Long"):**
* Similar to TPO, it measures how long price spent at each
level.
* **High Time:** True acceptance and fair value.
* **Low Time:** Rejection or rapid movement.
3. **VELOCITY Profile (The "How Fast"):**
* Measures the **speed of trading** (Contracts per Second).
This reveals the hidden intent of market participants.
* **High Velocity (Fast Flow):** Aggression. Initiative
buyers/sellers are hitting market orders rapidly. Often
seen at breakouts or in liquidity vacu.
* **Low Velocity (Slow Flow):** Absorption. Massive passive
limit orders are slowing price down despite high volume.
Often seen at major reversals ("hitting a brick wall").
Key Features:
1. **Event-Based Profile Anchoring:** The indicator starts a new
profile based on one of three user-selected events
('Profile Anchor'):
- **Swing:** A new profile begins when the 'impulse baseline'
(derived from intra-bar delta) changes. This baseline
adjusts when a new **price pivot** is confirmed: When a
price **high** forms, the baseline moves to the **lower**
of its previous level or the peak delta (max of
delta O/C) at the pivot. When a price **low** forms, it
moves to the **higher** of its previous level or the
trough delta (min of delta O/C) at the pivot.
- **Structure:** A new profile begins immediately on the bar
that *confirms* a market structure break (e.g., a new HH
or LL, based on a sequence of price pivots).
- **Delta:** A new profile begins immediately on the bar
that *confirms* a break in the *cumulative delta's*
market structure (e.g., a new HH or LL in the delta).
Both 'Swing' and 'Delta' anchors are derived from the same
**continuous (non-resetting) Cumulative Volume Profile Delta (CVPD)**,
which is built from the intra-bar statistical analysis.
2. **Statistical Profile Engine:** For each bar in the anchored
period, the indicator builds a volume profile on a lower
'Intra-Bar Timeframe'. Instead of simple tick counting, it
uses advanced statistical models:
- **Allocation ('Allot model'):** 'PDF' (Probability Density
Function) distributes volume proportionally across the
bar's range based on an assumed statistical model
(e.g., T4-Skew). 'Classic' assigns all volume to
the close.
- **Buy/Sell Split ('Volume Estimator'):** 'Dynamic'
applies a model that analyzes candle wicks and
recent trend to estimate buy/sell pressure. 'Classic'
classifies all volume based on the candle color.
3. **Visualization & Lag:** The indicator plots the final
profile (as a polygon) and the developing statistical
lines (POC, VA, VWAP, StdDev).
- **Note on Lag:** All anchor events require `Pivot Right Bars`
for confirmation.
- In 'Structure' and 'Delta' mode, the developing lines
(POC, VA, etc.) are plotted using a **non-repainting**
method (showing the value from `pivRi` bars ago).
- In 'Swing' mode, the profile is plotted **retroactively**,
starting *from the bar where the pivot occurred*. The
developing lines are also plotted with this full
`pivRi` lag to align with the past data.
4. **Flexible Display Modes:** The finalized profile can be displayed
in three ways: 'Up/Down' (buy vs. sell), 'Total' (combined
volume), and 'Delta' (net difference).
5. **Dynamic Row Sizing:** Includes an option ('Rows per Percent')
to automatically adjust the number of profile rows (buckets)
based on the profile's price range.
6. **Integrated Alerts:** Includes 13 alerts that trigger for:
- A new profile reset ('Profile was resetted').
- Price crossing any of the 6 developing levels (POC,
VA High/Low, VWAP, StdDev High/Low).
- **Alert Lag Assumption:** In 'Swing' mode, alerts are
delayed to match the retroactively plotted lines.
In 'Structure' and 'Delta' modes, alerts fire in
**real-time** based on the *current price* crossing
the *current (repainting)* value of the metric, which
may **differ from the non-repainting plotted line.**
**Caution: Real-Time Data Behavior (Intra-Bar Repainting)**
This indicator uses high-resolution intra-bar data. As a result, the
values on the **current, unclosed bar** (the real-time bar) will
update dynamically as new intra-bar data arrives. This includes
the values used for real-time alerts in 'Structure' and
'Delta' modes.
---
**DISCLAIMER**
1. **For Informational/Educational Use Only:** This indicator is
provided for informational and educational purposes only. It does
not constitute financial, investment, or trading advice, nor is
it a recommendation to buy or sell any asset.
2. **Use at Your Own Risk:** All trading decisions you make based on
the information or signals generated by this indicator are made
solely at your own risk.
3. **No Guarantee of Performance:** Past performance is not an
indicator of future results. The author makes no guarantee
regarding the accuracy of the signals or future profitability.
4. **No Liability:** The author shall not be held liable for any
financial losses or damages incurred directly or indirectly from
the use of this indicator.
5. **Signals Are Not Recommendations:** The alerts and visual signals
(e.g., crossovers) generated by this tool are not direct
recommendations to buy or sell. They are technical observations
for your own analysis and consideration.

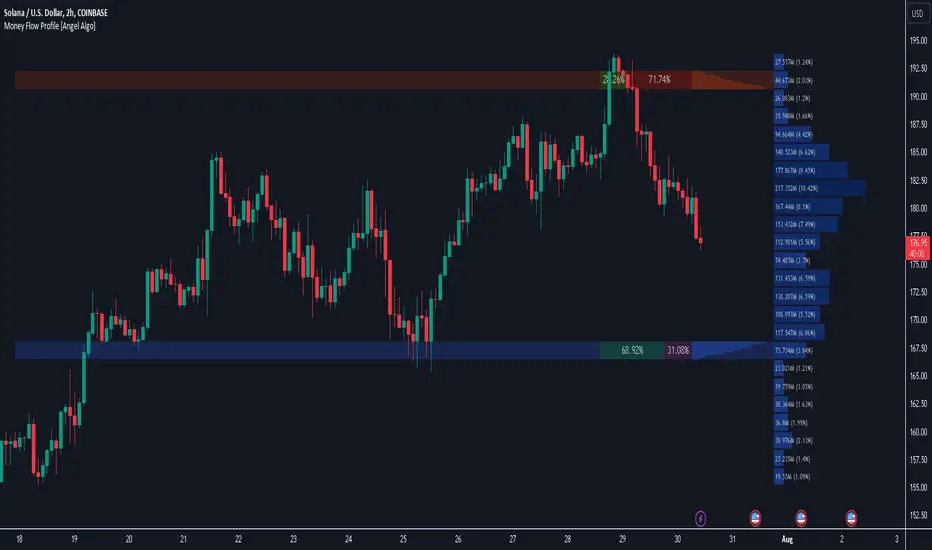
Money Flow Profile [Angel Algo]Money Flow Profile
Overview
This indicator is designed to analyze trading activity and identify key supply and demand zones using volume and money flow data. It is an advanced tool for traders who want to incorporate volume profile analysis into their trading strategy, enhancing their ability to spot potential reversal zones and understand market sentiment.
Features
1. Customizable Lookback Period
Description: Users can specify the number of bars to consider in the volume profile calculation, allowing for flexible analysis over different periods.
Functionality: This setting adjusts the depth of historical data analyzed, enabling traders to tailor the indicator to various trading styles and timeframes.
2. Row Size Configuration
Description: This input determines the number of rows (or price levels) displayed in the volume profile.
Functionality: By adjusting the row size, traders can get a more granular or more generalized view of trading activity at different price levels.
3. Data Source Selection
Options: Volume, Money Flow
Description: Traders can choose between using traditional volume data or money flow for the volume profile calculation.
Functionality: Money flow incorporates both price and volume to give a more comprehensive view of market buying and selling pressure, while volume focuses solely on trading activity.
Volume:
Money Flow:
4. Color Gradient for Volume Intensity
Description: The script allows setting maximum and minimum colors to create a gradient that visually represents the intensity of trading activity.
Functionality: This visual aid helps traders quickly identify areas of high and low trading activity, enhancing the interpretability of the volume profile.
Advanced Analysis: Supply and Demand Zones
1. Sentiment Analysis-Based Zoning
Description: The script analyzes the volume profile bars above and below the current close price to detect zones with significant buying or selling pressure.
Methodology:
Supply Zones: Identified by analyzing bars above the current close and finding the area with the highest selling pressure, indicated by volume delta.
Demand Zones: Identified by analyzing bars below the current close and finding the area with the highest buying pressure.
2. Volume Delta Calculation
Description: Volume delta, the difference between buy and sell volumes, is used to gauge the strength of buying or selling pressure at each price level.
Functionality: This calculation helps pinpoint the most significant supply and demand zones, providing traders with potential entry and exit points based on market sentiment.
Usage Scenario
This indicator is particularly useful for traders who focus on intraday trading, swing trading, or any strategy that benefits from understanding volume dynamics and sentiment at specific price levels. It allows traders to visually assess which levels are likely to act as resistance or support, based on historical trading activity and current market sentiment.
Conclusion
By integrating both traditional and innovative analytical methods, this Indicator offers a powerful tool for market analysis. Its flexibility and depth provide traders with valuable insights into market dynamics.
Juice RemedyThis Remedy suite is a remake of the Auto Remedy suite.
We have improved the performance and added a few new features.
Updated:
- Converted some boxes to lines to mitigate the limit of 500.
- Rewrote the code and disabled blocks if features are turned off
New features:
- RSI based candle colors
- Added features to limit historical renders
---
RSI Candles tells you the RSI and volatility by coloring the candlesticks. The different stages are: overbought, oversold, neutral and a top and bottom RSI / EMA crossover.
There is also an option to enable the RSI signal on the chart to see when it's entering an overbought or oversold area.
---
Volume Profile displays a vertical histogram on the right side of the price chart, representing the volume traded at each price level. The length of each bar corresponds to the total volume traded at that particular price level. Traders can analyze the shape and distribution of the Volume Profile to gain valuable information about the market structure.
Here's how Volume Profile is used and applied in trading:
Identifying Areas of High Volume:
Volume Profile helps traders identify areas of high trading activity. Peaks in the Volume Profile histogram indicate price levels where significant buying or selling pressure was present. These areas can act as support or resistance levels in the future, as they represent levels where traders have previously shown interest.
Understanding Price Acceptance and Rejection:
Volume Profile assists in determining whether the market has accepted or rejected specific price levels. When the volume is higher at a particular price level, it suggests that traders have accepted that price and consider it fair. On the other hand, low volume at a price level indicates rejection, suggesting that traders are not willing to transact at that price.
Identifying Value Areas:
Volume Profile can help identify value areas, which are price regions where the most volume has been traded. These areas are considered significant as they reflect levels where the market has found fair value and attracted substantial trading activity. Traders often pay attention to these value areas as potential support or resistance zones.
Confirming Breakouts and Reversals:
Volume Profile can be used to confirm the validity of breakouts and reversals. If a price breaks out of a range with high volume, it suggests strong conviction and increases the likelihood of a sustained move. Similarly, if a price reverses near a high-volume area, it provides additional confirmation of a potential trend reversal.
Assessing Market Sentiment:
By analyzing the shape and structure of the Volume Profile, traders can gain insights into market sentiment. A balanced Volume Profile with volume evenly distributed across price levels indicates a neutral market. Skewed or asymmetrical Volume Profiles may suggest bullish or bearish sentiment, depending on where the volume is concentrated.
It's important to note that traders often combine Volume Profile with price patterns, trendlines, and momentum indicators to validate signals and develop a comprehensive understanding of the market.
By studying the Volume Profile, traders can gain a clearer picture of where significant trading activity has occurred and identify levels of potential support, resistance, and value. This information can assist in making more informed trading decisions and improving overall market analysis.
---
VWAP(Volume Weighted Average Price) is a technical analysis tool that calculates the average price weighted by trading volume over a specified time period. It provides traders with insights into the average price at which a particular asset has traded during a given period, considering the volume traded at each price level.
Here's a general explanation of VWAP and its application in trading:
Calculation of VWAP:
VWAP is calculated by multiplying the price of each trade by its corresponding volume, summing these values over a specific time period, and dividing the total by the cumulative volume. The calculation continuously updates as new trades occur within the specified time frame.
Interpretation of VWAP:
VWAP is primarily used as a reference point to assess whether a current price is relatively high or low compared to the average price weighted by volume. Traders compare the current price to the VWAP to gauge whether the price is trading above or below the average level. If the price is above VWAP, it suggests that the asset is trading at a premium, while a price below VWAP indicates a discount.
VWAP as a Trading Indicator:
Traders use VWAP in various ways to support their trading decisions. Here are a few common applications:
a. Trend Identification: Traders analyze the relationship between the current price and VWAP to identify the prevailing market trend. If the price consistently trades above VWAP, it is often seen as a bullish signal, while prices below the VWAP is considered a bearish signal. This approach helps traders align their trades with the overall market direction.
b. Support and Resistance Levels: VWAP can act as a dynamic support or resistance level. Traders observe how the price reacts when approaching the VWAP. If the price bounces off the VWAP and continues in the direction of the prevailing trend, it may indicate support or resistance. Traders can use the VWAP as a reference for setting stop-loss levels or determining potential entry or exit points.
c. Reversal Signals: In some cases, when the price deviates significantly from VWAP, it may indicate overbought or oversold conditions. Traders watch for price reversals when the price moves away from the VWAP, potentially signaling a short-term market reversal.
d. Volume Analysis: VWAP considers volume along with price, providing insights into the significance of price moves. Traders analyze the relationship between volume and VWAP to evaluate the strength of price movements. Higher volume trading near the VWAP may suggest increased market interest and potential continuation of the trend.
It's worth noting that the VWAP is often used in intra-day trading and is more relevant for short-term analysis. Traders typically adjust the VWAP time frame based on their trading style and the asset being analyzed.
---
The Zig Zag works by filtering out price movements below a certain threshold (percentage or points) and only displaying significant price changes. This helps to eliminate minor price fluctuations and focus on the more substantial market movements.
When applying the Zig Zag indicator, traders typically select a percentage or point value as the threshold. For example, if a 5% threshold is chosen, the Zig Zag indicator will only plot a new point when the price has moved up or down by at least 5% from the previous significant high or low.
The indicator plots lines connecting the significant highs and lows on the price chart, creating a zigzag pattern. The lines are drawn in a way that reflects the change in the trend direction. The indicator can be adjusted to suit different timeframes and trading styles.
The primary purpose of the Zig Zag indicator is to identify and highlight trend reversals and price swings. Traders often use it to:
Identify major turning points: The Zig Zag indicator helps traders spot major highs and lows in the price action. These levels can act as potential support or resistance areas for future price movements.
Filter out noise: By filtering out minor price fluctuations, the Zig Zag indicator helps traders focus on the more significant price moves and trends. This can provide a clearer picture of the overall market direction.
Confirm chart patterns: The Zig Zag indicator can be used to confirm the validity of chart patterns, such as trendlines, channels, or chart formations. It can help traders validate breakouts, pullbacks, or continuation patterns.
Set trailing stops: Traders may use the Zig Zag indicator to set trailing stops based on the significant swing highs and lows. This allows them to trail their stop-loss orders behind the price action and potentially lock in profits as the trend develops.
Additionally, it's essential to customize the settings of the Zig Zag indicator according to the specific market being analyzed, as different markets and timeframes may require different threshold values for optimal performance.
Please keep in mind that while the Zig Zag indicator can provide valuable insights, it should be used alongside other analysis tools and not solely relied upon for trading decisions.
---
Fibonacci extensions and retracements are both technical analysis tools that traders use to identify potential levels of support and resistance in financial markets. Here's a clear understanding of each concept and how they are used in trading:
1. Fibonacci Retracement:
Fibonacci retracement is based on the idea that after an upward or downward price movement, the price tends to retrace a portion of that move before continuing in the original direction. The key levels used in Fibonacci retracement are based on ratios derived from the Fibonacci sequence, such as 0.382 (38.2%), 0.500 (50%), and 0.618 (61.8%).
To apply Fibonacci retracements, traders typically select two significant points on a price chart: a swing high and a swing low. The retracement levels are then plotted as horizontal lines based on the Fibonacci ratios. These levels act as potential support (in an uptrend) or resistance (in a downtrend) where the price may reverse or consolidate before resuming the overall trend.
Traders often use Fibonacci retracement levels to identify potential entry or exit points, place stop-loss orders, or assess the strength of a trend. The most commonly used retracement levels are 38.2%, 50%, and 61.8%, but other Fibonacci ratios like 23.6% and 78.6% are also sometimes used.
2. Fibonacci Extension:
Fibonacci extension is used to identify potential price targets beyond the initial trend or price move. It helps traders determine where the price may reach once it surpasses the previous swing high or swing low.
Similar to Fibonacci retracement, Fibonacci extension levels are derived from the Fibonacci sequence. The most commonly used extension levels are 138.2%, 161.8%, 261.8%, and 423.6%, although other ratios can also be applied.
To use Fibonacci extension, traders select three points on a price chart: a swing low, a swing high (corresponding to the previous trend), and a subsequent swing low or swing high (from where the extension is projected). The extension levels are then projected beyond the swing high or swing low, acting as potential price targets or areas of interest.
Fibonacci extension levels are often used to determine potential profit targets or to identify areas where a trend may reverse or consolidate. Traders may also use extensions in conjunction with other technical analysis tools to confirm trade signals or assess the overall market structure
---
The Pitchfan tool is based on the concept of Andrew's Pitchfork, which is a popular technical analysis tool developed by Dr. Alan H. Andrews. It consists of three parallel trendlines that are drawn to encompass the price action of an asset. The trendlines are typically drawn by connecting three significant points on a price chart - usually a pivot high, a pivot low, and another pivot high.
Once the Pitchfork is plotted, the Pitchfan tool extends the concept by adding additional trendlines that are parallel to the original Pitchfork. These additional trendlines are drawn based on certain mathematical ratios (e.g., Fibonacci ratios) applied to the distance between the original trendlines.
The Pitchfan can be used to identify potential support and resistance levels, as well as potential areas for price reversal or continuation. Traders may look for price reactions near these trendlines, with the expectation that the price may find support or encounter resistance at these levels.
---
Higher timeframe opens refer to the opening prices of different sessions or timeframes above the one being currently analyzed. For example, in intra-day trading, higher timeframe opens can refer to the daily session open or the opening prices of other significant market sessions in the forex market.
In addition to higher timeframe opens, traders often utilize daily reference ranges by incorporating indicators such as Average True Range (ATR) and the previous day's range. These tools help traders gauge the potential price volatility for the day and establish reference levels for stop-loss orders, profit targets, overall risk management strategies and market knowledge to develop a comprehensive trading approach.
---
Disclaimer : Please note that trading success relies on adhering to your trading strategy, and indicators should be used in accordance with your strategy rather than being the sole basis for trading decisions.
The provided script is intended solely for informational and educational purposes. Its use does not constitute professional or financial advice. It is your sole responsibility to evaluate the script's output and assess the risks associated with its use. By utilizing the script, you agree not to hold "JuiceSignals" TradingView user liable for any potential claims for damages that may arise from decisions made based on the use of the script.

TwV Multi-timeframe Dynamic VRVPMulti-timeframe Dynamic Visible Range Volume Profile
The volume profile is an indicator that displays trading activity over a specified period and plots a histogram on the chart which reveals dominant and significant price levels based on volume and in essence gives a clear indication of Supply or demand at a certain price rather than volume in a certain period.
What makes this VRVP indicator different from other is that it is multi-timeframe and dynamic, meaning that it has the ability to show the POC for a higher timeframe and that it also recalculates the main POC every single time traders adjust the chart.
Most VRVP need to be adjusted to a fixed position for the Main POC, I made an improvement by giving the indicator the ability to identify the bars that are being look at in the screen, this really gives traders the possibility and agility to identify potential support and resistance areas without the need to be changing any settings on the indicator.
Furthermore, giving the ability to the indicator to be multi-timeframe allows traders not only to work with a point of control in one timeframe, but also have a dashed line plotting the Point of Control of a HIGHER timeframe, which could potentially be a strongest support or resistance. The multi-timeframe point of control is fixed only.
This VRVP is completely similar to the official Trading View paid subscription one.
Fundamentals
Point of Control (POC): The price level for the time period with the highest traded volume. The POC is represented by an amber line within the indicator.
Profile High: The highest reached price level during the specified time period
Profile Low: The lowest reached price level during the specified time period.
Value Area (VA): The range of price levels in which a specified percentage of all volume was traded during the time period. Typically, this percentage is set to 70% however it is up to the trader’s discretion.
Value Area High (VAH): The highest price level within the value area.
Value Area Low (VAL): The lowest price level within the value area.
Usage
The Resistance and Support levels can be provided by the Volume profile using a reactive method so they constantly change with price action and give a clearer picture to predict future price movements. The Reactive method relies on past price movements at certain price levels and applies a more significant understanding of price reaction at certain meaningful levels
Support levels will be areas where price will be supported on the way down.
Resistance levels will be areas that resist price on the way up.
A basic understanding of this is that Buyers will enter the market at the bottom of a profile and sellers will enter the market at the top of the profile.
Configuration
By the default the indicator has enabled plotting the charts timeframe Volume Profile.
Multi-timeframe option needs to be enabled and desired timeframe chosen from selector menu.
Bars back value for fixed calculation of the multi-timeframe point of control.
Traders can adjust default settings as follows:
Charts timeframe VRVP
Main POC color – Yellow
Positive Volume – Green
Negative Volume – Red
VRVP Width – 100 (Refers to the plotting width for better suiting on small screens)
Multi timeframe VRVP
Enable or disable calculations
Bars back - Fixed numbers of bars for calculation (Consider that max bars back limit is 5000, but it considers 5000 bars on the current charts timeframe, therefore traders need to take into consideration converting number of bars in higher timeframe to charts timeframe)
e.g.
Charts timeframe 15m – MTF desired 1H
1H = 60 min 15m = 15 min – 100 bars back equivalent to (60 min * 100) / 15 = 400
Lower than 5000 then calculations takes place, otherwise calculations will be disabled.
Multi-timeframe POC color = Light blue DASHED
Timeframe desired – 1H by default
Summary box
Enable or disable box
Box shows information regarding the exact price where Main POC and MTF POC reside
Table Size for better fitting on mobile devices
able Position for adjusting to each trader’s preference or use in combination with other indicators

OutsiderEdge - Adaptive Session Flow Engine🔹 OVERVIEW
The OutsiderEdge – Adaptive Session Flow Engine (ASFE) is a professional-grade session analysis tool that visualizes true session-based volume distribution, key auction nodes, and institutional interaction levels across Asia, London, and New York.
ASFE is designed to help traders understand where price actually traded, where it was accepted or rejected, and how liquidity reacts around session-defined control levels without repainting or hindsight bias.
🔹 FEATURES
Session Volume Profile Core
True session-anchored volume profiles (Asia / London / New York)
Independent profiles per session with automatic close handling
Configurable row resolution and value area coverage
Optional background session shading
Control Nodes (POC & POV)
Point of Control (POC): highest volume acceptance level
Point of Volume (POV): lowest volume / thin auction node inside value area
Displayed for both closed and developing sessions
Visual separation between acceptance and rejection zones
Adaptive Extension Logic
POC / POV levels extend forward until interaction
Two extension modes: Until Breach or Until N Retests
Non-repainting, bar-confirmed logic
Fully session-aware behavior
Retest Engine (NBE-Compatible)
Optional retest mode with configurable retest count
Retest logic based on clean approach + rejection
Supports final-retest-only signaling
Consistent behavior with OutsiderEdge NBE methodology
Session Filters & Trade Windows
Trade Inside / Skip Inside session logic
Independent control for Asia, London, and New York
Ensures signals only occur during intended trading windows
Visual Feedback & Labels
Directional breach labels (bullish / bearish)
Clear differentiation between POC and POV interactions
Optional body-based rejection filtering
Minimalist, chart-friendly visuals
🔹 ALERT SYSTEM
Breach Alerts
Alert on any POC or POV interaction
Directional alerts (Long / Short)
Separate alerts for POC and POV
Retest Alerts
Alerts on valid retests when retest mode is enabled
Optional final-retest-only signaling
Designed for automation and discretionary workflows
🔹 WHY ASFE?
Session-First Design
Levels are derived from session structure, not arbitrary lookbacks
Respects real market transitions between sessions
Auction Market Logic
POC = acceptance
POV = rejection / inefficiency
Helps distinguish continuation vs rotation environments
Built for Confluence
Works alongside price action, footprint, delta, and orderflow tools
Designed as a decision-support engine, not a signal spam indicator
🔹 WHO IS THIS FOR?
Discretionary Traders
Session-based traders
Liquidity and auction-theory traders
Index, FX, and futures traders
System & Automation Traders
Clear, deterministic alert conditions
Non-repainting logic
Suitable for strategy integration and execution layers
🔹 IMPORTANT NOTES
This indicator does NOT repaint
All signals are generated on confirmed bars
ASFE does NOT provide trade entries or exits by itself
Always combine with proper risk management and context
Trading involves substantial risk. This tool is for educational purposes only and is not financial advice. Past performance does not guarantee future results. You are solely responsible for your trading decisions and risk management.

Max. Liquidity & Delta Bias Profile @MaxMaserati 3.0MAX. LIQUIDITY & DELTA BIAS PROFILE @MAXMASERATI 3.0
═══════════════════════════════════════════════════════════════
OVERVIEW
────────
An advanced volume profile tool that analyzes market liquidity and order flow dynamics across different timeframes. This indicator helps traders identify key price levels where significant trading activity and directional bias converge.
DUAL PROFILE SYSTEM
───────────────────
🔷 LIQUIDITY PROFILE (Right Side)
Displays total volume traded at each price level, colored by market bias:
• Green nodes = Bullish dominance (buyers in control)
• Red nodes = Bearish dominance (sellers in control)
• Width represents volume concentration at that level
🔷 DELTA BIAS PROFILE (Left Side)
Shows net buying vs selling pressure at each price level:
• Blue nodes = Positive delta (buying pressure dominates)
• Purple nodes = Negative delta (selling pressure dominates)
• Width represents strength of the imbalance
KEY REFERENCE LEVELS
─────────────
📍 POC (Point of Control)
Yellow horizontal line marking the price with highest traded volume - represents the most accepted fair value during the period.
📍 MAX BULL Level
Green line highlighting the price with strongest bullish conviction - where buyers showed maximum aggression and commitment.
📍 MAX BEAR Level
Red line highlighting the price with strongest bearish conviction - where sellers demonstrated maximum pressure and control.
TOGGLE OFF EVERYTHING EXCEPT THE MAX LINES TO HAVE THIS SETUP
PROFILE STATUS INDICATORS
──────────────────────────
• ▶ ONGOING (Green) = Current developing profile
• ⬛ STOPPED (Red) = Completed profile, new period started
CUSTOMIZATION FEATURES
──────────────────────
✓ Multiple anchor periods (Auto/Session/Day/Week/Month/Quarter/Year)
✓ Independent toggles for each visual element
✓ Individual color and size controls for every label
✓ Adjustable profile width and transparency
✓ Customizable line widths and styles
TRADING APPLICATIONS
────────────────────
• Identify high-probability support/resistance zones
• Spot institutional accumulation/distribution levels
• Detect order flow imbalances before major moves
• Track intraday value areas and fair price zones
• Confirm trend strength through delta analysis
• Find optimal entry/exit levels based on volume
WHO THIS IS FOR
───────────────
Designed for active traders who:
• Trade futures, stocks, forex with volume data
• Use volume profile and market profile concepts
• Analyze order flow and institutional footprints
• Seek data-driven price level identification
• Want visual clarity on market structure
NOTES
─────
• Requires volume data to function properly
• Best used on liquid instruments with consistent volume
• Profiles reset based on selected anchor period
• All visual elements can be toggled independently
• Performance optimized for real-time analysis
⚠️ DISCLAIMER
Educational Tool Only - This indicator is for educational and informational purposes only and does not constitute financial, investment, or trading advice.
Risk Warning - Trading involves substantial risk of loss and is not suitable for all investors. Past performance does not guarantee future results. No representation is made that this indicator will achieve profits or prevent losses.
User Responsibility - All trading decisions are solely your responsibility. The developer and Max Maserati Model assume no liability for losses incurred from using this indicator. Conduct your own research and consult a qualified financial advisor before making investment decisions.
Data Dependency - Indicator accuracy depends on your TradingView plan's data availability and selected timeframe support.
By using this indicator, you acknowledge and agree to these terms.

Kriptano short sniperKriptano short sniper
An indicator for finding SHORT entry points after sharp price movements in the cryptocurrency market.
Features:
Pump Detector: Automatically detects price spikes on 15m, 30m, and 1h intervals with customizable thresholds.
Resistance Levels: Dynamic lines on 7 timeframes (5m-1W) with automatic deletion after a breakout.
Volume Profile: Volume distribution by price levels with a sentiment profile (bullish/bearish zones). Can help identify pump reversal points.
Kriptano short sniper
Индикатор для поиска точек входа в SHORT после резких ценовых движений на криптовалютном рынке.
Возможности:
Детектор пампа: автоматическое выявление скачков цены на интервалах 15m, 30m, 1h с настраиваемыми порогами
Уровни сопротивления: динамические линии с 7 таймфреймов (5m-1W) с автоудалением после пробития
Volume Profile: распределение объема по ценовым уровням с профилем настроений (бычьи/медвежьи зоны). Может помочь в определении точки разворота пампа.

Navigator Triple VolumeNavigator Triple Volume (VWAP + Fixed VP + Flexible VP)
**Navigator Triple Volume** combines three of the most practical volume-based tools into one clean overlay:
1. **VWAP (anchored) with optional deviation bands**
2. **Fixed Volume Profile** (auto-building by anchor timeframe, with optional developing/current profile)
3. **Flexible Volume Profile** (manual start/end window for custom range analysis)
The goal is simple: give you **institutional-grade context**—where price is “fair,” where volume is accepted, and where the real inventory is sitting—without stacking multiple indicators.
1) Anchored VWAP + Bands
This script plots an **anchored VWAP** and optional **±1 and ±2 standard deviation bands** to help you gauge:
* “Fair value” (VWAP)
* Stretch/extension zones (deviation bands)
* Mean reversion vs. trend strength around VWAP
Anchor period options include **Daily, Week, Month, Quarter, Year**, and event-based anchors like **Earnings, Dividends, and Splits** (where supported).
2) Fixed Volume Profile
The Fixed VP automatically builds a **completed profile each time the anchor timeframe rolls over** (ex: Daily). It can also display the **current/developing profile** for the active anchor period.
Includes:
* **PoC (Point of Control)**
* **Value Area (VAH/VAL)** based on a configurable % (default 68%)
* Adjustable **rows (resolution)**, **profile width**, and **bar thickness**
3) Flexible Volume Profile
Flexible VP lets you define a **custom range** using a manual **Start Calculation** and **End Calculation** time selection. This is ideal for:
* Single swing legs
* News/event reactions
* Range breaks
* “From low to high” campaign profiling
Includes:
* PoC + Value Area levels
* Adjustable profile resolution and styling
How traders use it
* Use **VWAP** as the “fair value” magnet and trend filter
* Use **Fixed VP** to identify session/period acceptance and key reference levels
* Use **Flexible VP** to profile *your chosen range* and locate the true battleground: PoC, VAH, and VAL
When all three agree, it’s a high-confidence area for decision-making. When they disagree, it often signals transition or rotation.
Notes
* This indicator draws profiles using TradingView line objects and includes controls to manage performance and display preferences.
* Built for chart clarity: one script, three volume lenses.

Aggressive VS Passive Orders Depletion @MaxMaserati 3.0Aggressive VS Passive Orders Depletion Indicator
Overview
This institutional-grade order flow analysis tool identifies and tracks limit order accumulation zones where significant buy and sell orders are placed in the market. It combines Highest Volume Candle Profile analysis with Market Structure detection to reveal where institutional traders have positioned their orders, and monitors in real-time whether these orders are being absorbed (depleted) or defended.
Core Concept: Order Block Detection & Depletion
This tool tracks the actual limit orders at key price levels and shows you:
Where institutional orders are placed (Buy Order Blocks vs Sell Order Blocks)
How strong these order zones are (original volume strength as %)
Real-time order flow activity (aggressive buyers vs aggressive sellers)
Depletion status (are the orders being consumed or defended?)
How It Works: Dual-Engine System
Engine 1: Volume Profile Analysis - Point of Control (POC) Detection
Divides price range into 25 horizontal levels (configurable)
Analyzes the last 120 bars (configurable lookback)
Distributes volume across price levels based on where each bar traded
Identifies the Point of Control (POC) - the price level with highest traded volume
Determines market bias: Bullish if price above POC, Bearish if below
Purpose: Shows where the majority of volume has been traded, indicating institutional accumulation zones and fair value areas.
Engine 2: Market Structure Analysis (PHL - Pivot High/Low)
Uses fractal pivot detection (configurable strength)
Identifies swing highs and lows that create market structure
Tracks Break of Structure (BOS) - price breaks recent swing in trend direction
Tracks Market Structure Shift (MSS) - price breaks swing points against trend
Maintains a trailing price at the most recent significant swing point
Purpose: Identifies where smart money is likely defending key structural levels with limit orders.
Key Innovation #1: Dynamic Confluence Zone Detection
When the Volume Profile POC and Market Structure trail price align within a configurable sensitivity threshold (default 1.0%), the indicator creates an Order Block Zone.
The Algorithm:
Monitors both engines continuously
Creates zones ONLY when POC is within X% of the structural swing point
Both engines must agree on the significance of the price level
Optional volume confirmation filter
This dual-confirmation approach filters out weak levels and highlights only the highest-probability zones where institutional orders are likely clustered.
Zone Types:
🟢 Buy Order Blocks (Support) - Created when confluence occurs with price above the zone. Represents accumulated buy limit orders waiting to support price.
🔴 Sell Order Blocks (Resistance) - Created when confluence occurs with price below the zone. Represents accumulated sell limit orders waiting to resist price.
Key Innovation #2: Real-Time Aggressive VS Passive Order Flow Analysis
The indicator performs sophisticated order flow decomposition on each candle that interacts with a zone, separating market activity into distinct categories:
Order Flow Categories:
1. Aggressive Orders - Market orders that consume liquidity
Aggressive Buy Volume: Market buys hitting sell limits (taking offers)
Aggressive Sell Volume: Market sells hitting buy limits (hitting bids)
Marked with (AGG) label when detected
Indicates urgent traders willing to pay the spread
2. Passive Orders - Limit orders adding liquidity
Passive Buy Volume: New buy limits being placed (making bids)
Passive Sell Volume: New sell limits being placed (making offers)
Shows patient traders providing liquidity
3. New Order Flow - Fresh buying/selling pressure
New Buyers: Total new buying activity (aggressive + passive)
New Sellers: Total new selling activity (aggressive + passive)
Net pressure indicator for zone health
Key Innovation #3: Advanced Order Flow Decomposition Algorithm
The indicator uses a proprietary candle analysis formula to separate aggressive from passive orders based on two key metrics:
Key Metrics:
Body Strength = |Close - Open| / (High - Low)
Close Position = (Close - Low) / (High - Low)
Bullish Candle Analysis:
Strong Aggressive Buying (Close Position ≥ 0.8 AND Body Strength ≥ 0.7):
90% aggressive buying, 10% passive selling, 90% new buyers
Moderate Aggressive Buying (Close Position ≥ 0.6 AND Body Strength ≥ 0.5):
70% aggressive buying, 20% passive selling, 80% new buyers, 20% new sellers
Weak Bullish (Close Position ≥ 0.5):
0-30% aggressive buying, 20-30% passive selling, 60% new buyers, 40% new sellers
Very Weak Bullish (Close Position < 0.5):
0% aggressive buying, 40% passive selling, 40% new buyers, 60% new sellers
Bearish Candle Analysis:
Strong Aggressive Selling (Close Position ≤ 0.2 AND Body Strength ≥ 0.7):
90% aggressive selling, 10% passive buying, 90% new sellers
Moderate Aggressive Selling (Close Position ≤ 0.4 AND Body Strength ≥ 0.5):
70% aggressive selling, 20% passive buying, 80% new sellers, 20% new buyers
Weak Bearish (Close Position ≤ 0.5):
0-30% aggressive selling, 20-30% passive buying, 60% new sellers, 40% new buyers
Very Weak Bearish (Close Position > 0.5):
0% aggressive selling, 40% passive buying, 40% new sellers, 60% new buyers
What This Reveals:
High close position + strong body = Aggressive buying overwhelming sellers
Low close position + strong body = Aggressive selling overwhelming buyers
Mid-range close = Battle between buyers and sellers
Small body = Passive orders dominating (limit orders being placed, not filled)
Key Innovation #4: Dynamic Depletion System with Intelligent Thresholds
The indicator adapts depletion thresholds based on zone strength:
High Liquidity Zones (>300% volume strength):
Depletion at 40% consumption - Massive clusters considered broken early because partial depletion indicates institutional withdrawal
Medium Liquidity Zones (150-300% volume strength):
Depletion at 60% consumption - Standard institutional behavior, majority must be consumed
Normal Liquidity Zones (75-150% volume strength):
Depletion at 80% consumption - Retail and smaller institutional zones need near-complete absorption
Low Liquidity Zones (<75% volume strength):
Depletion at 100% consumption - Weak zones must be fully absorbed before marked depleted
Why This Matters:
Strong zones failing early = powerful reversal signal (institutions gave up)
Weak zones holding = hidden strength (more orders being added)
Adaptive logic prevents false signals from fixed thresholds
Depletion Formula:
For Buy Order Zones:
Zone Liquidity % = (Original Buy Volume / Average Volume) × 100
Consumed % = (Sell Volume Absorbed / Average Volume) × 100
If Consumed Volume > Dynamic Threshold → Zone DEPLETED
For Sell Order Zones:
Zone Liquidity % = (Original Sell Volume / Average Volume) × 100
Consumed % = (Buy Volume Absorbed / Average Volume) × 100
If Consumed Volume > Dynamic Threshold → Zone DEPLETED
Key Innovation #5: Absorption Detection & Battle Analysis
The indicator identifies when one side is overwhelming the other using a configurable Absorption Threshold (default 1.5x = 50% more volume).
Battle States for Buy Order Blocks:
New Buyers Dominating (New Buyers > New Sellers × 1.5):
Label: ↑ New Buyers: +X% - Buy orders successfully defended
Sellers Attacking (New Sellers > New Buyers × 1.5):
Label: ↓ Sellers Attack: +X% (AGG) - Sell orders overwhelming the zone
Active Battle (Both active, <1.5x ratio):
Label: Battle: B+X% vs S+Y% - Active two-way order flow
Quiet Zone (Minimal activity):
Label: ↔ Quiet: X% - Zone untested or ignored
Battle States for Sell Order Blocks:
New Sellers Dominating (New Sellers > New Buyers × 1.5):
Label: ↓ New Sellers: +X% - Sell orders successfully defended
Buyers Absorbing (New Buyers > New Sellers × 1.5):
Label: ↑ Buyers Absorb: +X% (AGG) - Buy orders overwhelming the zone
Active Battle (Both active, <1.5x ratio):
Label: Battle: S+X% vs B+Y% - Active two-way order flow
Quiet Zone (Minimal activity):
Label: ↔ Quiet: X% - Zone untested or ignored
The (AGG) Marker:
Appears when aggressive market orders are detected (high body strength + extreme close position). Indicates institutional-sized urgency—someone is willing to pay market price NOW. Often precedes breakouts or strong continuations.
Label System Explained
No Label = Untested Zone
When a zone is first created, you see ONLY the colored box with NO label. This means:
Price has NOT yet reached this order block
The limit orders are still pending/resting
The zone is a future area of interest
Labels only appear after first price contact
Label Format (After First Touch):
Line 1: ● XX% Order Type
Line 2: Flow Analysis
Example Labels:
Buy Order Blocks:
● 150% Buy Orders + ↑ New Buyers: +85%
● 150% Buy Orders + ↑ New Buyers: +120% (AGG)
● 150% Buy Orders + Battle: B+45% vs S+38%
● 150% Buy Orders + ↓ Sellers Attack: +95% (AGG)
● 150% Buy Orders + ↓ Sellers Attack: +95% (AGG)
● 150% Buy Orders
Sell Order Blocks:
● 200% Sell Orders + ↓ New Sellers: +110%
● 200% Sell Orders + ↓ New Sellers: +140% (AGG)
● 200% Sell Orders + Battle: S+62% vs B+41%
● 200% Sell Orders + ↑ Buyers Absorb: +88% (AGG)
● 200% Sell Orders + ↑ Buyers Absorb: +88% (AGG)
● 200% Sell Orders
Status Indicators:
- Price penetrated through the zone
- Orders fully consumed, zone exhausted
Gray color - Zone no longer active
Directional Arrows:
↑ - Upward pressure (buyers stronger)
↓ - Downward pressure (sellers stronger)
↔ - Balanced/quiet (low activity)
↗ / ↘ - Mixed battle with bias
Point of Control (POC) Sub-Level Analysis
Each order block contains advanced volume distribution tracking:
Multi-Level Analysis (default 5 levels): Zones subdivided into horizontal price levels
Volume Distribution: Every candle's volume distributed across sub-levels based on price overlap
Buy/Sell Separation: Each level tracks buy vs sell volume independently
Dynamic POC Line: Marks the price level with highest traded volume within the zone
Real-Time Updates: POC adjusts as new volume enters, showing where "fairest price" is migrating
Style Options: Solid, Dashed, or Dotted lines (configurable width 1-5)
POC Trading Significance:
Represents the most accepted price within the order block
Often the best entry price for limit orders (highest liquidity)
POC migration shows whether zone is being "worked higher" or "worked lower"
Breaking through POC often signals zone failure
Key Settings
Volume Profile:
Lookback Period: 120 bars (historical period for POC)
Price Rows: 25 levels (granularity of volume distribution)
Volume Confirmation: Require structure breaks to align with volume bias
Market Structure:
Pivot Strength: 1 (swing detection sensitivity)
Show Trail: Optional trailing price visualization
Confluence Detection:
Sensitivity: 1.0% (distance threshold for POC/Structure alignment)
Lower = Stricter confluence, fewer zones
Higher = More zones detected
Order Flow Analysis:
Show Real-Time Order Flow: Live buyer/seller activity
Show Aggressive Markers: (AGG) labels for market orders
Show Directional Arrows: Price direction indicators (↑↓↔↗↘)
Absorption Threshold: 1.5x (when one side overwhelms the other)
1.5 = 50% more volume needed
2.0 = 100% more (stricter)
1.2 = 20% more (more sensitive)
Visual Options:
Hide Depleted Zones: Auto-remove exhausted blocks
Smart Bar Coloring: Color candles based on signal alignment
Zone Colors: Customize buy/sell colors
Label Text Size: Tiny, Small, Normal, Large
POC Settings:
Show POC Lines: Toggle Point of Control display
POC Analysis Levels: 3-10 levels
Line Width: 1-5 pixels
Line Style: Solid, Dashed, or Dotted
Trading Applications
1. Institutional Order Detection - Identify where large players positioned limit orders using Volume Profile POC + Market Structure confluence
2. Support/Resistance Validation - Dual confirmation filters weak levels, highlights high-probability reversal areas
3. Order Flow Imbalance Trading - Trade in direction of aggressive flow using (AGG) markers, fade zones showing absorption
4. Breakout/Breakdown Confirmation - and statuses validate moves through key levels
5. Liquidity Hunting - Track stop-loss clusters, anticipate stop runs based on depletion patterns
6. Entry Refinement - Use POC lines for precise limit placement at "fairest price" within zones
Combined Signal System
HVN Volume Profile × Market Structure Signals:
STRONG BUY: Both engines bullish + structure break up + volume confirmation
BUY: Bullish bias with partial confirmation
WEAK BUY: Early bullish signals
STRONG SELL: Both engines bearish + structure break down + volume confirmation
SELL: Bearish bias with partial confirmation
WEAK SELL: Early bearish signals
Alert Conditions:
Strong Buy/Sell signals (with volume confirmation)
Confluence zone activation (new order block created)
Order block depletion (zone exhausted)
What Makes This Indicator Unique
Industry-Standard Foundation:
Volume Profile POC detection + Market Structure analysis (swing pivots, BOS/MSS) + Point of Control tracking
Unique Innovations:
Dynamic Confluence Algorithm + Aggressive vs Passive Order Flow Decomposition + Adaptive Depletion Thresholds + Real-Time Absorption Detection + Battle Analysis with (AGG) markers + Complete Unified Methodology
Technical Excellence:
Resource-optimized (max 50 zones), comprehensive safety checks, multi-tier labeling, flexible customization
Best Practices
Wait for first touch - No label = untested zone
Watch (AGG) markers - Institutional urgency signal
Trust adaptive depletion - Strong zones failing early = major reversal
Use POC for entries - Best price within zone
Combine higher timeframes - Daily/4H zones strongest
Respect zones - Failed support becomes resistance
Follow battle labels - Contested areas show stop clusters
Adjust sensitivity - Tight ranges = lower %, trending = higher %
Performance Notes
Maximum Active Zones: 50 (automatic cleanup)
Maximum Lines: 400 (POC managed dynamically)
Lookback Cap: 1000 bars for optimization
Updates: All calculations on bar close for confirmed signals

HTF Candle Profile [ChartPrime]⯁ OVERVIEW
The HTF Candle Profile visualizes higher-timeframe candle structure and its internal volume distribution directly on lower-timeframe charts. It automatically detects changes in higher-timeframe periods (daily, weekly, or monthly) and constructs a complete volume profile for each, allowing traders to see how volume is distributed across the range of that higher-timeframe candle. This helps identify whether momentum is supported by real volume strength or trapped price movement.
⯁ LOGIC
When a new higher-timeframe candle begins, the indicator starts collecting data for its open, high, low, close, and volume range.
Once sufficient bars have passed (defined by the Min Period Profile input), it calculates a full profile using adaptive bin sizing derived from the range (High–Low) and ATR for scaling precision.
The resulting bins represent the volume concentration at each price level of that higher-timeframe candle.
A Point of Control (PoC) is highlighted — the level where the most volume occurred.
The indicator then draws the higher-timeframe candle body and wicks at the chart’s right side, giving visual context of bullish or bearish sentiment.
⯁ FEATURES
Automatic HTF Detection: Identifies new Daily, Weekly, or Monthly periods and updates profiles in real time.
Dynamic Bin Calculation: Automatically adjusts bin size based on ATR and candle height for accurate volume granularity.
Volume Profile Rendering: Displays colored volume bars extending from the candle, showing where trading activity was concentrated.
Higher-Timeframe Candle Representation: Plots the full HTF candle (open, close, high, low) on the right side of the chart for visual clarity.
PoC Level & Labels: Marks the point of maximum volume within the candle profile with a line and volume label.
Configurable Levels: Toggle display of Open, Close, High, Low, and PoC for each higher-timeframe segment.
Color-coded Sentiment: Candle and profile colors reflect bullish or bearish momentum.
⯁ CONCLUSION
The HTF Candle Profile bridges lower- and higher-timeframe analysis by embedding high-resolution volume data within each major candle. It enables traders to see where liquidity and trading activity cluster inside higher-timeframe structures — revealing whether trends are volume-backed or hollow. Perfect for combining structural insight with volume confluence when analyzing market sentiment transitions across timeframes.

Volume Dynamics Pro [ChartNation]Volume Dynamics Pro by ChartNation is an advanced volume profile indicator that visualizes volume distribution across price levels using a proprietary mirrored butterfly design. The indicator identifies high-volume nodes (areas of significant trading activity) and the Point of Control (POC) - the price level with the highest traded volume within the lookback period.
KEY FEATURES:
Dynamic Volume Profile: Displays volume distribution across 25 price bins with a mirrored butterfly visualization that extends into future bars for forward-looking analysis
Point of Control (POC): Automatically identifies and highlights the price level with maximum volume, featuring a pulsing animation and optional price label with customizable positioning
Multiple Anchoring Modes: Choose between Rolling, Daily, Weekly, Monthly, or Session-based profile calculations to match your trading timeframe
Smart Range Calculation: Three range modes (Fixed Lookback, Hybrid Smart, Percentage-Based) automatically adjust the volume profile range based on recent price action
Volume-Responsive Visualization: Line thickness and glow intensity scale with volume magnitude, making high-volume areas immediately visible
Premium Statistics Box: Real-time display of POC price, total volume, range metrics, and price position relative to POC
Advanced Alert System: Configurable alerts for POC crosses, range breakouts, high-volume zone entries, and volume spikes
Professional Styling: Volume-based line styles (solid/dashed/dotted), gradient bias coloring (support/resistance), dual-tone depth borders, and customizable glow effects
HOW IT WORKS:
The indicator divides the price range into 25 bins and calculates total volume traded at each level. The mirrored butterfly profile displays this distribution, with wider sections indicating higher volume. The POC line marks the price with maximum activity - a critical level often acting as support or resistance.
Volume traces are color-coded: green tint below current price (potential support), red tint above (potential resistance). The intensity of coloring increases as price approaches each level, helping traders identify nearby high-volume zones.
USE CASES:
Identify institutional order flow and accumulation/distribution zones
Locate high-probability support and resistance levels based on actual trading activity
Track POC shifts to understand changing market structure
Confirm breakout validity by analyzing volume at key price levels
Optimize entry/exit points around high-volume nodes
SETTINGS OVERVIEW:
The indicator offers extensive customization across multiple groups: POC styling and extensions, statistics box display, profile anchoring, range calculation modes, alert configuration, line styles, volume-proportional thickness, gradient bias, glow system, depth borders, POC pulse animation, and volume profile display parameters.

Smart Liquidity 📊 # 💎 Smart Liquidity Indicator - User Guide
## 📋 Overview
**Smart Liquidity Indicator** is an advanced technical analysis tool for analyzing liquidity and volume in financial markets. It combines several powerful analytical tools to help you make informed trading decisions.
---
## 🎯 Main Components
### 1. 📊 Volume Profile
- **Function**: Displays volume distribution across different price levels
- **Benefit**: Identify strong support and resistance zones based on trading activity
- **Elements**:
- Colored boxes representing volume density at each level
- Labels showing HIGH/LOW of the price range
- PEAK FLOW line indicating the strongest volume level
### 2. 📦 Order Blocks
- **Function**: Identify bullish and bearish Order Block zones
- **Benefit**: Potential areas for price reversal or trend continuation
- **Displayed Information**:
- Delta %: Zone strength (difference between buying and selling pressure)
- Liquidity: Accumulated liquidity in the zone
- Buy/Sell ratios within the zone
### 3. 📈 SuperTrend (Market Direction)
- **Two lines for confirmation**:
- **🎯 Current SuperTrend** (Green/Red): Current timeframe direction
- **🔄 MTF SuperTrend** (Light Green/Red): Higher timeframe direction (4H default)
- **Benefit**: Trade with the overall market trend
### 4. 📊 Dashboard (Information Panel)
- Display current market status
- Trend and momentum information
- Active Order Blocks statistics
---
## 🚀 How to Use
### 1️⃣ **Reading Volume Profile**
- **Dense boxes** = High volume accumulation areas = Strong support/resistance
- **PEAK FLOW line** = Strongest price level (POC - Point of Control)
- **HIGH/LOW Labels** = Boundaries of the analyzed price range
### 2️⃣ **Analyzing Order Blocks**
- **Positive Delta (+)** = Strong buying pressure → Reliable bullish zone
- **Negative Delta (-)** = Strong selling pressure → Reliable bearish zone
- **Delta near 0** = Balance → Weak zone, avoid it
### 3️⃣ **Using SuperTrend**
- **Current TF (Green bullish / Red bearish)**: Current timeframe direction
- **MTF (Light Green bullish / Light Red bearish)**: Higher timeframe direction
- **Best Trading**: When both lines agree on the same direction
### 4️⃣ **Suggested Strategy**
```
✅ Strong Entry Signal:
1. Order Block with strong Delta (>30% or <-30%)
2. Current SuperTrend and MTF in the same direction
3. Volume Profile confirms the level (dense box or PEAK)
4. Price tests the zone for the first time
❌ Avoid Entry When:
- Weak Delta (between -10% and +10%)
- Conflict between Current and MTF SuperTrend
- Zone tested multiple times (weakened)
```
---
## 🎨 Understanding Colors
### Order Blocks
- 🟢 **Green**: Bullish Order Block
- 🔴 **Red**: Bearish Order Block
### SuperTrend
- 🟢 **Green**: Current SuperTrend bullish (same color as Order Blocks)
- 🔴 **Red**: Current SuperTrend bearish (same color as Order Blocks)
- 🟢 **Light Green**: MTF SuperTrend bullish
- 🔴 **Light Red**: MTF SuperTrend bearish
**Note**: Each SuperTrend has different transparency levels based on trend strength
### Volume Profile
- **Gradient from light to dark**: Represents volume density (darker = higher volume)
---
## ⚡ Performance Tips
### For Maximum Speed (Current Settings):
✅ **Enabled**:
- Order Blocks: 2 zones per side
- Volume Profile: 20 levels
- SuperTrends: Both active
- Strength Delta: Displayed
❌ **Disabled** (for speed):
- Gradient Fill
- Predictive Zones
- Background Fill
- MTF Calculations (in internal calculations)
### If Indicator is Slow:
1. Reduce `Profile Rows` from 20 → 15
2. Reduce `Lookback Period` from 50 → 40
3. Reduce `Max Zones` from 2 → 1
4. Turn off `Show OB Labels` if not needed
---
## 🔄 Additional Tools
### ♻️ Reset Now
- **Location**: Visual Tweaks
- **Usage**: If Volume Profile is cluttered, enable it to redraw
- **Note**: Disable after use
### 🎯 Draw Mode
- **Live**: Direct drawing on the last candle
- **Confirmed**: Draw only on closed candles (more stable)
---
## ⚠️ Disclaimer
### 🚨 Important Notice
**This indicator is a technical analysis tool only and is not considered financial advice or a trading recommendation.**
#### 📌 Please Note:
1. **Just an Analytical Tool**:
- The indicator provides technical information based on historical data
- Past results do not guarantee future results
2. **Personal Responsibility**:
- You are solely responsible for your own trading decisions
- Conduct your own research before making any investment decision
- Use appropriate risk management (Stop Loss, Position Sizing)
3. **No Guarantees**:
- There is no guarantee of profit or success in trading
- Financial markets carry high risks
- You may lose your entire invested capital
4. **Consult a Professional**:
- Consult a licensed financial advisor before making important investment decisions
- Ensure you fully understand the risks associated with trading
5. **Proper Use**:
- The indicator is designed as an assistive tool, not an automated trading system
- Preferably combine it with your own analysis and other tools
- Do not rely on a single signal alone
#### ⚖️ Acceptance:
By using this indicator, you acknowledge and agree that:
- The indicator developer is not responsible for any financial losses
- All trading decisions are your personal responsibility
- You understand the risks associated with trading in financial markets
---
## 💡 Final Advice
**"The best traders use tools wisely, not blindly"**
- Learn how the indicator works before relying on it
- Test settings on a demo account first
- Always use Stop Loss
- Don't risk more than you can afford to lose
---
## 📞 Contact and Support
**If you need any help or have any questions, feel free to contact me.**
I'm here to help you understand and use the indicator correctly! 🤝
---
**Good Luck & Trade Safe! 🚀📈**

Volume Range Map [BigBeluga]This volume-based tool identifies the highest and lowest price extremes within a lookback period and constructs two dynamic range zones. Each zone is filled with horizontal volume profiles that visualize the distribution of traded volume across price bins, helping traders pinpoint key areas of accumulation and distribution.
🔵Key Features:
Dynamic High/Low Zones:
➣ Automatically detects the highest and lowest price levels within a custom lookback window.
➣ Draws two shaded zones: one near the high and one near the low, representing potential supply and demand areas.
Volume Profiles per Zone:
➣ Each zone is filled with a volume profile histogram divided into bins.
➣ The length of each horizontal bar represents the relative volume traded at that price level.
➣ Bins collectively account for 100% of the zone’s volume.
POC Highlighting:
➣ The price bin with the highest volume is marked as the Point of Control (POC), along with a label showing its share of total volume in percentage.
➣ A dashed line is drawn at the middle level of the zone.
Customizable Display:
➣ Traders can adjust the number of bins, zone width, and toggle midline visibility to match their strategy needs.
➣ Colors of upper and lower volume zones are fully customizable.
🔵Usage:
Supply/Demand Analysis: Use upper/lower volume zones to find key reversal or continuation areas where market participants were most active.
Volume Confirmation: Confirm breakout or rejection trades by watching how price reacts to high-volume areas inside each zone.
POC Strategy: Treat POC levels as magnet zones — price tends to revisit them due to high liquidity.
Trade Planning: Use volume-weighted levels instead of raw price action to plan entries, stop-losses, and targets.
Volume Range Map offers a clean and powerful way to analyze volume distribution at price extremes. By combining precise volume histograms, POC highlights, and adaptive zone drawing, it brings market structure into sharper focus for range and breakout traders alike.

Volume Delta Imbalance Index [PhenLabs]📊 Volume Delta Imbalance Index (VDII)
Version: PineScript™ v6
Description
The Volume Delta Imbalance Index is an advanced technical analysis tool that combines volume profile analysis with price movement dynamics to identify significant market imbalances. It features a sophisticated analysis system that weighs recent versus historical volume delta imbalance patterns, providing traders with insights into potential market reversals and trend continuation scenarios.
Points of Innovation:
Custom volume delta calculation incorporating price and volume relationships
Adaptive smoothing system based on market volatility
Multi-component analysis combining flow, acceleration, and strength metrics
Real-time volume profile integration with historical context
🔧 Core Components
Volume Profile Analysis: Dynamic volume delta imbalance distribution assessment
Flow Imbalance Detection: Buy/sell pressure evaluation
Strength Analysis: Composite market strength measurement
Acceleration Framework: Volume movement dynamics
Statistical Bands: Adaptive threshold system
🚨 Key Features 🚨
The indicator provides comprehensive analysis through:
Volume Delta: Up to date volume imbalance measurement
Market Structure: Support/resistance level identification
Flow Analysis: Buy/sell pressure visualization
Acceleration Signals: Movement momentum detection
Adaptive Bands: Dynamic overbought/oversold levels
📈 Visualization
Color-coded Columns: Shows direction and strength of imbalance
Signal Lines: Strong buy/sell level indicators
Statistical Bands: Shows normal trading ranges
Gradient Fills: Indicates extreme market conditions
Dynamic Opacity: Reflects trend strength
📌 Usage Guidelines
The indicator offers several customization options:
Basic Settings:
Lookback Period: Analysis timeframe adjustment
Sensitivity Level: Signal response calibration
History Depth: Historical context range
Memory Setting: Recent vs. historical data weight
Visual Settings:
Color Scheme: Bullish/bearish signal colors
Signal Levels: Strong buy/sell thresholds
Band Display: Statistical range visualization
✅ Best Use Cases / Things To Look For:
Wait for establishment in the initial trend when the VDII comes back towards zero and the color of the volume becomes more faint
Once this is established and the VDII pushes through to the other side look for small retracements above the zero line on the VDII leading you to believe it is a likely area for price to retrace and continue in its prior direction
Make sure you see the volume bars become more faint in color to give yo further confluence price will continue in its priorly established direction
⚠️ Limitations
Requires sufficient volume data
Most effective in liquid markets
Historical depth affects calculation speed
Possible lag in highly volatile conditions
What Makes This Unique
Composite Volume Analysis: Combines multiple volume metrics
Adaptive Calculation: Adjusts to market volatility
Profile Integration: Incorporates volume profile analysis
Multi-component Scoring: Weighted analysis system
Memory-efficient Design: Optimized for real-time analysis
🔧 How It Works
The indicator processes market data through four main components:
1. Volume Profile Analysis:
Creates dynamic volume delta distribution profiles
Weights recent versus historical data
Identifies significant price levels
2. Flow Imbalance Detection:
Analyzes buying versus selling pressure
Calculates normalized flow ratios
Determines market bias
3. Strength Analysis:
Measures composite market strength
Incorporates volume-weighted movements
Provides trend strength indication
4. Final Score Calculation:
Combines all components with weighted importance
Applies volatility-based smoothing
Generates final signal output
5. VDII Potential Reversal Confluences
Bars between signal confluence is default set to 10 but you can change it to whatever you’d prefer
Signals are a compiled look at the indicator as a whole determining where it think reversals or retracements are likely
💡 Note:
The indicator performs best in markets with consistent volume and clear trending or ranging conditions. Its sophisticated volume analysis provides valuable insights into market dynamics beyond traditional price-based indicators.

Dollar Volume DivergenceOverview
The Dollar Volume Profile and Divergence Indicator is a comprehensive tool designed to analyze both standard volume and dollar volume activity in the market. It visualizes dollar volume (calculated as close * volume) and highlights divergences between dollar volume and standard volume, providing insights into underlying market dynamics that aren't immediately visible with traditional volume analysis.
Key Features
Dollar Volume Profile:
Plots dollar volume as a histogram.
Highlights high-dollar volume bars in green (indicating significant trading activity).
Includes an optional average dollar volume line to show trends over time.
Volume-Divergence Analysis:
Calculates the difference (divergence) between dollar volume and standard volume.
Displays positive divergence (dollar volume > standard volume) in green and negative divergence (dollar volume < standard volume) in red.
Supports both histogram and boolean point visualization for divergence, offering flexibility in how the data is displayed.
Customizable Visualization:
Users can toggle between a Histogram or Boolean Points for divergence visualization.
Option to enable or disable the dollar volume profile and its average line.
Adjustable length parameter to fine-tune sensitivity for averages and divergences.
Use Cases
Volume Confirmation: Analyze whether dollar volume aligns with standard volume to confirm strong price movements.
Divergence Detection: Identify areas where dollar volume and standard volume deviate, which may signal potential reversals or exhaustion in a trend.
Market Strength Analysis: Assess the intensity of trading activity at specific price levels to determine key areas of interest.
How It Works
Dollar Volume Calculation:
Dollar volume is derived by multiplying the close price by the volume for each bar.
A moving average of dollar volume is used to determine relative activity levels.
Divergence Calculation:
The script calculates the difference between dollar volume and standard volume.
Positive values indicate that dollar volume exceeds standard volume, suggesting institutional or larger-scale trades.
Negative values highlight areas of lower dollar volume compared to standard volume.
Visualization:
The Dollar Volume Profile is displayed as a histogram, with high-dollar volume bars highlighted.
Divergences are overlaid as either a histogram or triangle markers, depending on user preference.
Average lines (optional) provide smoother trends for both dollar volume and divergence.
Customization Options
Length: Adjusts the period for moving average calculations.
Plot Style: Choose between Histogram or Boolean Points for divergence visualization.
Toggle Visibility: Enable or disable the Dollar Volume Profile and its average line for a cleaner chart.
Why Use This Indicator?
This indicator bridges the gap between traditional volume analysis and dollar volume analysis, offering deeper insights into market behavior. By combining these metrics, traders can detect nuanced patterns, validate trends, and identify divergences that may signal market turning points or continuation.
Best Practices
Use this indicator in conjunction with price action and other technical indicators for confirmation.
Look for divergences in high-dollar volume areas to detect potential trend reversals.
Analyze the interaction between the dollar volume profile and divergence histogram for a comprehensive view of market activity.
Important Notice:
Trading financial markets involves significant risk and may not be suitable for all investors. The use of technical indicators like this one does not guarantee profitable results. This indicator should not be used as a standalone analysis tool. It is essential to combine it with other forms of analysis, such as fundamental analysis, risk management strategies, and awareness of current market conditions. Always conduct thorough research or consult with a qualified financial advisor before making trading decisions. Past performance is not indicative of future results.
Disclaimer:
Trading financial instruments involves substantial risk and may not be suitable for all investors. Past performance is not indicative of future results. This indicator is provided for informational and educational purposes only and should not be considered investment advice. Always conduct your own research and consult with a licensed financial professional before making any trading decisions.
Note: The effectiveness of any technical indicator can vary based on market conditions and individual trading styles. It's crucial to test indicators thoroughly using historical data and possibly paper trading before applying them in live trading scenarios.

Depth of Market (DOM) [LuxAlgo]The Depth Of Market (DOM) tool allows traders to look under the hood of any market, taking price and volume analysis to the next level. The following features are included: DOM, Time & Sales, Volume Profile, Depth of Market, Imbalances, Buying Pressure, and up to 24 key intraday levels (it really packs a punch).
As a disclaimer, this tool does not use tick data, it is a DOM reconstruction from the provided real-time time series data (price and volume). So the volume you see is from filled orders only, this tool does not show unfilled limit orders.
Traders can enable or disable any of the features at will to avoid being overwhelmed with too much information and to make the tool perform faster.
The features that have the biggest impact on performance are Historical Data Collection, Key Levels (POC & VWAP), Time & Sales, Profile, and Imbalances. Disable these features to improve the indicator computational performance.
🔶 DOM
This is the simplest form of the tool, a simple DOM or ladder that displays the following columns:
PRICE: Price level
BID: Total number of market sell orders filled or limit buy orders filled.
SELL: Sell market orders
BUY: Buy market orders
ASK: Total number of market buy orders filled or limit sell orders filled.
The DOM only collects historical data from the last 24 hours and real-time data.
Traders can select a reset period for the DOM with two options:
DAILY: Resets at the beginning of each trading day
SESSIONS: Resets twice, as DAILY and 15.5 hours later, to coincide with the start of the RTH session for US tickers.
The DOM has two main modes, it can display price levels as ticks or points. The default is automatic based on the current daily volatility, but traders can manually force one mode or the other if they wish.
For convenience, traders have the option to set the number of lines (price levels), and the size of the text and to display only real-time data.
By default, the top price is set to 0 so that the DOM automatically adjusts the price levels to be displayed, but traders can set the top price manually so that the tool displays only the desired price levels in a fixed manner.
🔹 Volume Profile
As additional features to the basic DOM, traders have access to the volume profile histogram and the total volume per price level.
This helps traders identify at a glance key price areas where volume is accumulating (high volume nodes) or areas where volume is lacking (low volume nodes) - these areas are important to some traders who base their decision-making process on them.
🔹 Imbalances
Other added features are imbalances and buying pressure:
Interlevel Imbalance: volume delta between two different price levels
Intralevel Imbalance: delta between buy and sell volume at the same price level
Buying Pressure Percent: percentage of buy volume compared to total volume
Imbalances can help traders identify areas of interest in the price for possible support or resistance.
🔹 Depth
Depth allows traders to see at a glance how much supply is above the current price level or how much demand is below the current price level.
Above the current price level shows the cumulative ask volume (filled sell limit orders) and below the current price level shows the cumulative bid volume (filled buy limit orders).
🔶 KEY LEVELS
The tool includes up to 24 different key intraday levels of particular relevance:
Previous Week Levels
PWH: Previous week high
PWL: Previous week low
PWM: Previous week middle
PWS: Previous week settlement (close)
Previous Day Levels
PDH: Previous day high
PDL: Previous day low
PDM: Previous day middle
PDS: Previous day settlement (close)
Current Day Levels
OPEN: Open of day (or session)
HOD: High of day (or session)
LOD: Low of day (or session)
MOD: Middle of day (or session)
Opening Range
ORH: Open range high
ORL: Open range low
Initial Balance
IBH: Initial balance high
IBL: Initial balance low
VWAP
+3SD: Volume weighted average price plus 3 standard deviations
+2SD: Volume weighted average price plus 2 standard deviations
+1SD: Volume weighted average price plus 1 standard deviation
VWAP: Volume weighted average price
-1SD: Volume weighted average price minus 1 standard deviation
-2SD: Volume weighted average price minus 2 standard deviations
-3SD: Volume weighted average price minus 3 standard deviations
POC: Point of control
Different traders look at different levels, the key levels shown here are objective and specific areas of interest that traders can act on, providing us with potential areas of support or resistance in the price.
🔶 TIME & SALES
The tool also features a full-time and sales panel with time, price, and size columns, a size filter, and the ability to set the timezone to display time in the trader's local time.
The information shown here is what feeds the DOM and it can be useful in several ways, for example in detecting absorption. If a large number of orders are coming into the market but the price is barely moving, this indicates that there is enough liquidity at these levels to absorb all these orders, so if these orders stop coming into the market, the price may turn around.
🔶 SETTINGS
Period: Select the anchoring period to start data collection, DAILY will anchor at the start of the trading day, and SESSIONS will start as DAILY and 15.5 hours later (RTH for US tickers).
Mode: Select between AUTO and MANUAL modes for displaying TICKS or POINTS, in AUTO mode the tool will automatically select TICKS for tickers with a daily average volatility below 5000 ticks and POINTS for the rest of the tickers.
Rows: Select the number of price levels to display
Text Size: Select the text size
🔹 DOM
DOM: Enable/Disable DOM display
Realtime only: Enable/Disable real-time data only, historical data will be collected if disabled
Top Price: Specify the price to be displayed on the top row, set to 0 to enable dynamic DOM
Max updates: Specify how many times the values on the SELL and BUY columns are accumulated until reset.
Profile/Depth size: Maximum size of the histograms on the PROFILE and DEPTH columns.
Profile: Enable/Disable Profile column. High impact on performance.
Volume: Enable/Disable Volume column. Total volume traded at price level.
Interlevel Imbalance: Enable/Disable Interlevel Imbalance column. Total volume delta between the current price level and the price level above. High impact on performance.
Depth: Enable/Disable Depth, showing the cumulative supply above the current price and the cumulative demand below. Impact on performance.
Intralevel Imbalance: Enable/Disable Intralevel Imbalance column. Delta between total buy volume and total sell volume. High impact on performance.
Buying Pressure Percent: Enable/Disable Buy Percent column. Percentage of total buy volume compared to total volume.
Imbalance Threshold %: Threshold for highlighting imbalances. Set to 90 to highlight the top 10% of interlevel imbalances and the top and bottom 10% of intra-level imbalances.
Crypto volume precision: Specify the number of decimals to display on the volume of crypto assets
🔹 Key Levels
Key Levels: Enable/Disable KEY column. Very high performance impact.
Previous Week: Enable/Disable High, Low, Middle, and Close of the previous trading week.
Previous Day: Enable/Disable High, Low, Middle, and Settlement of the previous trading day.
Current Day/Session: Enable/Disable Open, High, Low and Middle of the current period.
Open Range: Enable/Disable High and Low of the first candle of the period.
Initial Balance: Enable/Disable High and Low of the first hour of the period.
VWAP: Enable/Disable Volume-weighted average price of the period with 1, 2, and 3 standard deviations.
POC: Enable/Disable Point of Control (price level with the highest volume traded) of the period.
🔹 Time & Sales
Time & Sales: Enable/Disable time and sales panel.
Timezone offset (hours): Enter your time zone\'s offset (+ or −), including a decimal fraction if needed.
Order Size: Set order size filter. Orders smaller than the value are not displayed.
🔶 THANKS
Hi, I'm makit0 coder of this tool and proud member of the LuxAlgo Opensource team, it's an honor to be part of the LuxAlgo family doing something I love as it's writing opensource code and sharing it with the world. I'd like to thank all of you who use, comment on, and vote for all of our open-source tools, and all of you who give us your support.
And of course thanks to the PineCoders family for all the work in front of and behind the scenes that makes the PineScript community what it is, simply the best.
Peace, Love & PineScript!

Order Flow: Structural Sniper [Profile + Signals]Overview
This script is a comprehensive tool designed to bridge the gap between Market Structure and Order Flow analysis. It aims to eliminate the subjectivity of static support and resistance lines by focusing on dynamic liquidity and the behavior of aggressive versus passive market participants.
Unlike traditional indicators that plot static data, the Structural Delta Map dynamically anchors its analysis to the start of the current trend (Pivots), providing a clear "X-Ray" view of how volume was distributed during the current price swing.
How it Works
The indicator combines three distinct technical concepts into a single system:
1. Market Structure (Pivots):
It uses a pivot detection algorithm to identify significant Swing Highs and Swing Lows. This determines the market bias and anchors the analysis to the origin of the movement.
2. Anchored VWAP (Fair Price):
It automatically calculates the Volume Weighted Average Price (VWAP) starting from the last confirmed pivot. This yellow line acts as the "spine" of the trend, serving as dynamic institutional support/resistance.
3. Delta Profile & Heatmap:
A Volume Profile is plotted on the left side, anchored to the pivot.
Split Delta: Instead of a single color, bars are split into Green (Buying Volume) and Red (Selling Volume) based on price action estimation.
Heatmap Logic: The opacity of the bars adjusts automatically. Bright/Solid bars represent High Volume Nodes (HVN), while transparent bars represent Low Volume Nodes (LVN) or liquidity voids.
How to Use (Strategy)
The indicator provides both visual context and specific entry signals:
1. Visual Context:
Profile: Look for reactions at bright, wide bars (High Volume Nodes). These act as magnets or barriers.
Yellow Line (VWAP): In an uptrend, look for buy opportunities when price retraces to this line. In a downtrend, look for shorts on the retest.
2. Aggression Signals (Triangle "AGR"):
Type: Trend Continuation / Pullback.
Logic: Triggers when price retraces to the structural value zone (near VWAP), rejects it with higher-than-average volume, and closes in the direction of the trend.
3. Absorption Signals (Cross "ABS"):
Type: Reversal / Trap.
Logic:
Bullish Absorption: Price makes a new local low with high volume (selling pressure), but the candle closes bullish (leaving a long bottom wick). Passive buyers absorbed the aggression.
Bearish Absorption: Price makes a new local high with high volume, but closes bearish. Passive sellers absorbed the buying pressure.
Settings
Pivot Sensitivity: Adjusts how the script detects trend changes.
Profile Resolution: Controls the number of rows in the histogram.
Signal Filters: Enable/Disable signals and adjust the Volume Multiplier threshold.
Technical Disclaimer
This indicator estimates "Delta" (Buy vs. Sell volume) based on OHLC price action and bar volume, as Pine Script does not grant access to historical tick-by-tick data. While this approximation is highly effective for identifying aggression and absorption, it differs slightly from Level 2 footprint data found on platforms like Sierra Chart. Accuracy depends on the volume data provided by your exchange.

SMC S&R MA Market Vol All Indicator[SumitQuants]🚀 SMC S&R + Market Sessions + Volume Profile + Order Flow Suite
The Only All-In-One Institutional Trading System You’ll Ever Need.
Looking for an indicator that actually brings clarity to chaotic markets?
Meet the SMC S&R MA Market Volume & Sessions Order Flow System — a powerhouse that fuses Smart Money Concepts, Session Profiles, and Dynamic Volume Flow into one ultra-optimized institutional toolkit.
This is not “just another SMC indicator.”
This is your complete trading ecosystem.
💠 What This Indicator Does (In Simple Terms)
It automatically reads the market the way institutions do — and displays it cleanly on your chart with zero clutter.
Below is everything packed inside 👇
🔥 1. Market Sessions + Volume Profile (Real Institutional Map)
✔ Tokyo- Asia | London- Europe | New York- US sessions auto-detected ⏱️
✔ Each session gets its own Volume Profile 📊
✔ See POC, VAH, VAL, Value Area Box for each session
✔ Live Developing Profile in real-time
✔ Wick-based and body-volume distribution for ultra-accurate auctions
✔ Session Boxes that highlight imbalance zones
✔ Perfect for:
High-volume Asia breaks
London volatility expansion
NY reversal traps
👉 Think of it as having pro-level TPO/Volume Profile inside TradingView.
🎯 2. Advanced S&R Strength Engine (Buyer vs Seller Power Meter)
✔ Detects strongest Support & Resistance zones
✔ Measures Buyer Strength & Seller Strength (% based)
✔ Auto-plots S/R Lines + S/R Zones
✔ Detects Bounce signals, Rejection points, Pressure shifts
✔ Zero repaint logic
You get institutional footprints directly on your chart.
📈 3. Smart Money Concepts (Full Automation)
✔ BOS / CHoCH detection
✔ Internal + Swing Structure
✔ Order Blocks (Internal + Swing)
✔ Equal Highs & Equal Lows
✔ Fair Value Gaps (FVG)
✔ Strong/Weak Highs + Lows labeling
✔ Trend coloring (optional)
✔ Premium / Discount Zones
All plotted with precision.
All customizable.
All built to remove guesswork.
💹 4. Multi-MA Engine (5 Fully Configurable MAs)
✔ EMA, SMA, WMA, VWMA, SMMA
✔ Choose length, color, and source
✔ Ideal for trend confirmation + dynamic S/R
Smooth. Clean. Non-laggy.
📊 5. Enhanced Supertrend (Toggles + Filters)
✔ Switch between Line / Histogram / Hidden
✔ Optional background trend coloring
✔ Buy/Sell signals with trend-change alerts
✔ No repaint
Perfect for directional bias.
⚡ 6. Breakout Detection + Volume Confirmation
✔ Auto-detects Support/Resistance Breaks
✔ Confirms breaks through Volume Surge % Oscillator
✔ Detects:
Bullish Breaks
Bearish Breaks
Bullish Rejections
Bearish Rejections
You instantly know when a breakout is real or fake.
📍 7. VWAP System with Multi-Band Zones
✔ Session-based VWAP
✔ Bands via Std Deviation or %
✔ Clean pullback zones
✔ Perfect for intraday institutions-style precision
🧠 8. Fully Integrated Alerts
Alerts for:
✔ BOS / CHoCH (Internal + Swing)
✔ Order Block Breakouts
✔ Equal Highs / Equal Lows
✔ Fair Value Gaps
✔ S/R Zone Interactions
✔ Trend Shifts
✔ Breakouts with Volume Confirmation
✔ Supertrend Reversals
And more.
Never miss major price shifts again.
🎨 9. Clean UI + Auto-Adaptive Watermark
✔ Auto-contrast watermark
✔ Minimalistic but premium
✔ Chart-friendly colors
✔ Built to match dark or light themes
🌍 Who This Indicator Is For?
✔ Intraday traders
✔ Swing traders
✔ SMC traders
✔ Volume/Order Flow traders
✔ Forex, Crypto, Index & Stocks
✔ Anyone wanting a single all-in-one trading system
🔥 Why 90% Traders Love This System
Because it gives you:
🔥 Session Bias
🔥 Volume-backed Zones
🔥 Clean Market Structure
🔥 Trend Bias + Liquidity Areas
🔥 Institutional S/R with Strength Meter
🔥 Accurate Order Flow Reactions
Everything you need to trade like top-tier professionals — without needing 10 indicators.
🛒 Get Full Access
This premium institutional system is available as part of the Courses Section on the official website.
👉 Purchase the indicator as a Course at:
www.ironmindtrader.com
Inside the course, you'll get:
✔ Access instructions
✔ Setup guide
✔ Trading rules
✔ Updates included
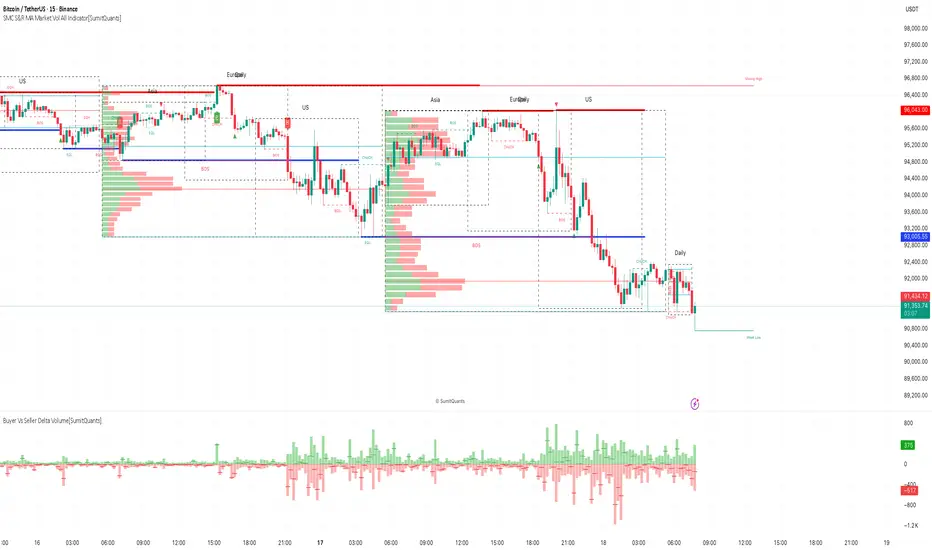
Impulse Profile Zones [BigBeluga]🔵 OVERVIEW
Impulse Profile Zones is a volume-based tool designed to highlight high-impact candles and visualize hidden liquidity zones inside them using microstructure data. It’s ideal for identifying volume concentration and potential reaction points during impulsive market moves.
Whenever a candle exceeds a specified size threshold, this indicator captures its structure and overlays a detailed intrabar volume profile (from a 10x lower timeframe), allowing traders to analyze the distribution of interest within powerful market impulses.
🔵 CONCEPTS
Filters candles that exceed a user-defined threshold by size.
For qualifying candles, retrieves lower timeframe price and volume data.
Divides the candle’s body into 10 volume bins and calculates the volume per zone. Highlights the bin with the highest volume as the Point of Control (POC) .
Each POC line extends forward until a new impulse is detected.
🔵 FEATURES
Impulse Candle Detection:
Triggers only when a candle’s body size is larger than the defined threshold.
Lower Timeframe Profiling:
Aggregates 10-bin volume data from a lower timeframe (typically 1/10 of current TF).
Volume Distribution Bars:
Each bin displays a stylized bar using unicode block characters (e.g., ▇▇▇, ▇▇ or ▇--).
The bar size reflects the relative volume intensity.
POC Zone Mapping:
The bin with the highest volume is marked with a bold horizontal line.
Its value is labeled and extended until the next valid impulse.
🔵 HOW TO USE
Use large candle profiles to assess which price levels inside a move were most actively traded.
Watch the POC line as a magnet for future price interaction (support/resistance or reaction).
Combine with market structure or order block indicators to identify confluence levels.
Adjust the “Filter Large Candles” input to detect more or fewer events based on volatility.
🔵 CONCLUSION
Impulse Profile Zones is a hybrid microstructure tool that bridges lower timeframe volume with higher timeframe impulse candles. By revealing where most of the volume occurred inside large moves, traders gain a deeper view into hidden liquidity, enabling smarter trade entries and more confident profit-taking zones.
